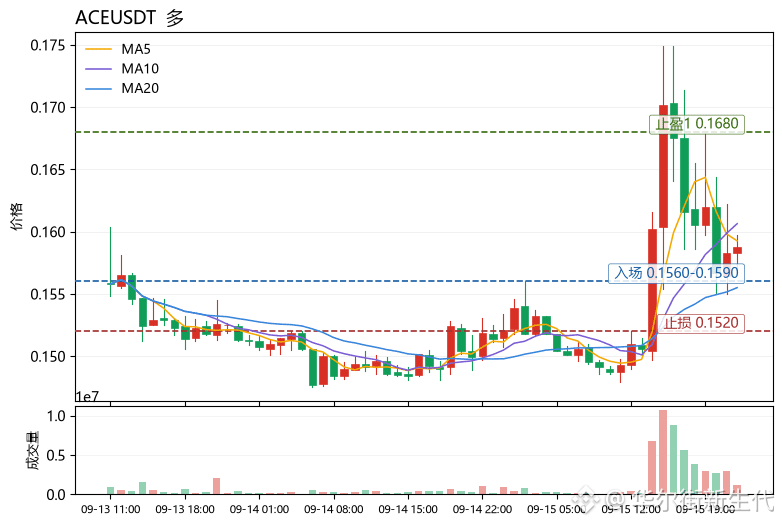
$ACE Current price 0.1588. Key short-term resistance 0.1682 (upper Bollinger band). Key support 0.1555 (MA20) and 0.1428 (lower Bollinger band).
From a technical perspective, MA5=0.1593 has crossed above MA20=0.1555. The short-term moving-average structure has turned into an early bullish alignment. Price is trading near MA5, which is within the pullback-confirmation zone after a breakout. The MACD histogram value +0.0001977 remains positive; bullish momentum is weak but not yet exhausted. RSI=54.9 is in a neutral-to-slightly-strong range; there is still room before it reaches overbought, suggesting the upside is not overextended. Bollinger Band width has moved from 0.1428 to 0.1682. The current price is above the mid-band but below the upper band, indicating a moderately strong consolidation pattern.
Notably, the funding rate is -0.2672%, meaning shorts are paying clearly. If price holds above MA20, there is potential for a short-squeeze style impulse driven by shorts closing positions. The Fear and Greed Index is 69, in the greed zone—sentiment is warm, but be cautious of volatility near higher levels.
Direction remains bullish. Entry reference: 0.1560–0.1590 (pullback into the range between MA5 and MA20, combined with bullish MACD and negative funding). Take-profit 1: 0.1680 (upper Bollinger band resistance; take partial profits as RSI nears 65). Take-profit 2: 0.1760 (extension target after breaking above the upper band; requires volume confirmation). Stop-loss: 0.1520 (a valid breakdown below MA20 and if the MACD histogram turns negative, the structure is considered damaged).
Also watch concurrently: $ICP and $FET. Their RSI levels are weak—about 23.5 and 26.4 respectively—so they are clearly weaker than ACE and do not currently have conditions for synchronized strength.
(Personal opinion only for reference and does not constitute any investment advice. Contract risk is extremely high—please strictly control position sizing.)
【Data】
Asset: ACEUSDT
Direction: Long
Entry: 0.1560-0.1590
Take-profit 1: 0.1680
Take-profit 2: 0.1760
Stop-loss: 0.1520
From a technical perspective, MA5=0.1593 has crossed above MA20=0.1555. The short-term moving-average structure has turned into an early bullish alignment. Price is trading near MA5, which is within the pullback-confirmation zone after a breakout. The MACD histogram value +0.0001977 remains positive; bullish momentum is weak but not yet exhausted. RSI=54.9 is in a neutral-to-slightly-strong range; there is still room before it reaches overbought, suggesting the upside is not overextended. Bollinger Band width has moved from 0.1428 to 0.1682. The current price is above the mid-band but below the upper band, indicating a moderately strong consolidation pattern.
Notably, the funding rate is -0.2672%, meaning shorts are paying clearly. If price holds above MA20, there is potential for a short-squeeze style impulse driven by shorts closing positions. The Fear and Greed Index is 69, in the greed zone—sentiment is warm, but be cautious of volatility near higher levels.
Direction remains bullish. Entry reference: 0.1560–0.1590 (pullback into the range between MA5 and MA20, combined with bullish MACD and negative funding). Take-profit 1: 0.1680 (upper Bollinger band resistance; take partial profits as RSI nears 65). Take-profit 2: 0.1760 (extension target after breaking above the upper band; requires volume confirmation). Stop-loss: 0.1520 (a valid breakdown below MA20 and if the MACD histogram turns negative, the structure is considered damaged).
Also watch concurrently: $ICP and $FET. Their RSI levels are weak—about 23.5 and 26.4 respectively—so they are clearly weaker than ACE and do not currently have conditions for synchronized strength.
(Personal opinion only for reference and does not constitute any investment advice. Contract risk is extremely high—please strictly control position sizing.)
【Data】
Asset: ACEUSDT
Direction: Long
Entry: 0.1560-0.1590
Take-profit 1: 0.1680
Take-profit 2: 0.1760
Stop-loss: 0.1520