Trading Idea|9/15 19:20
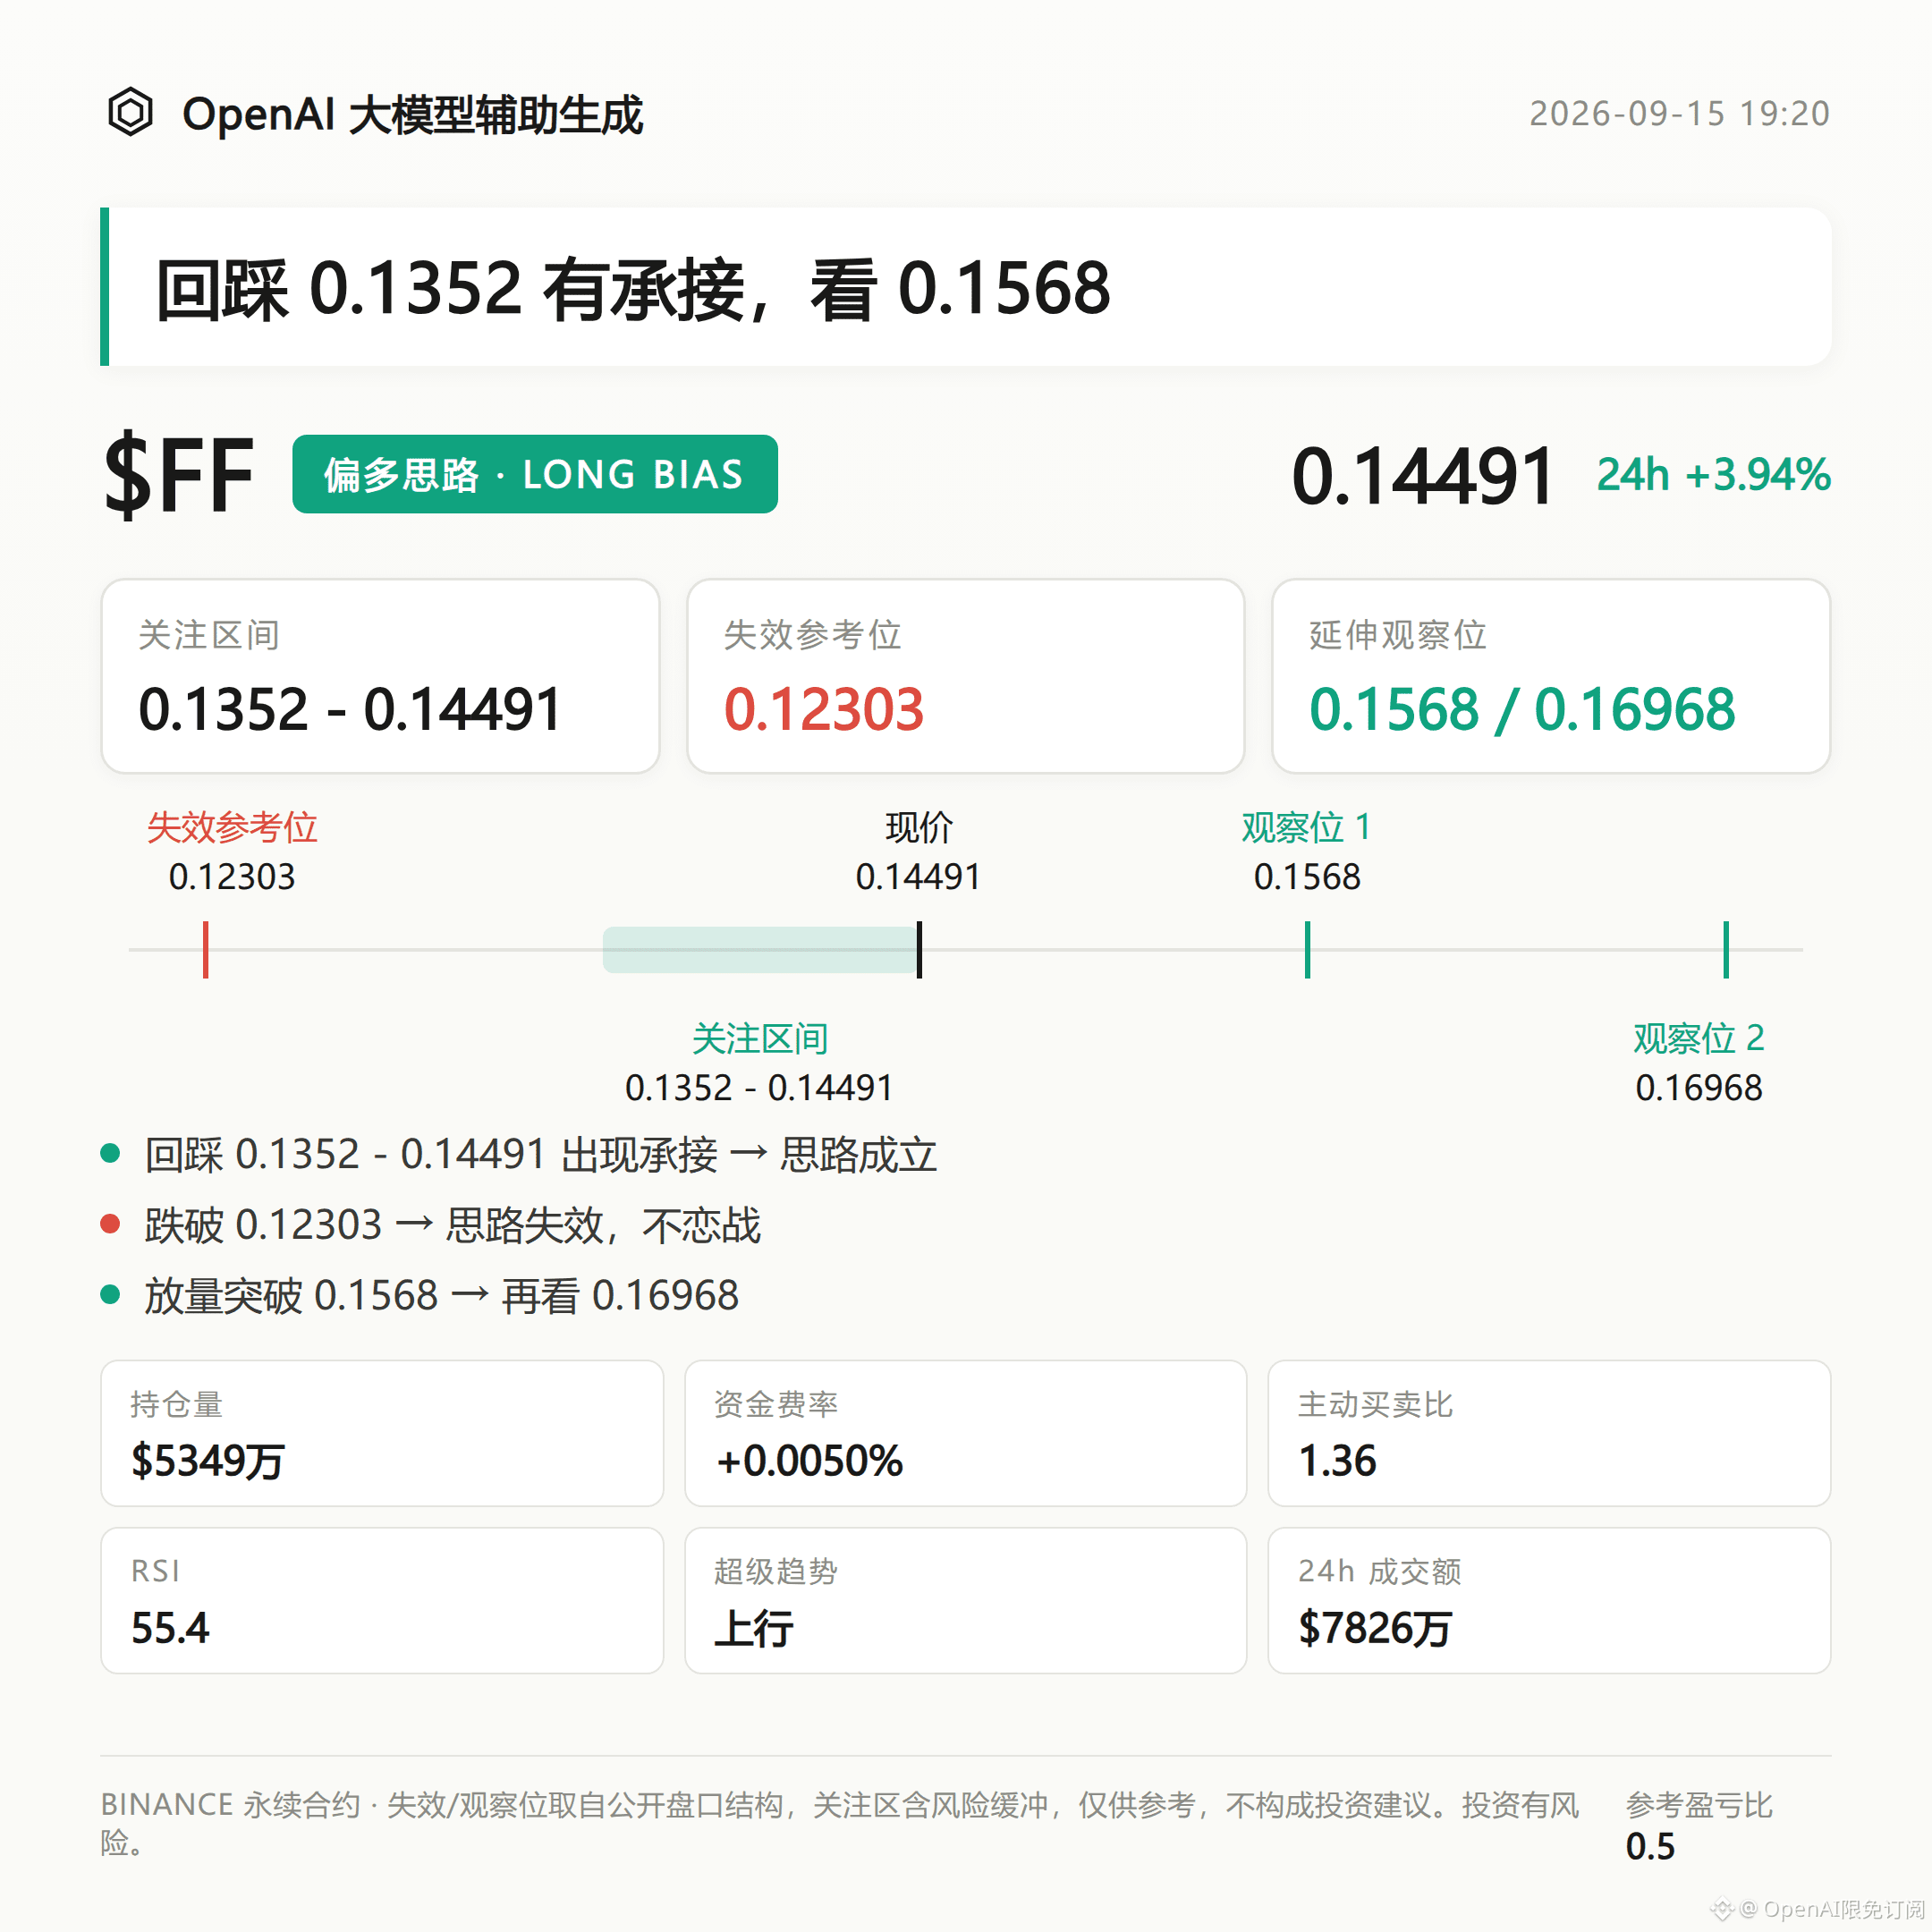
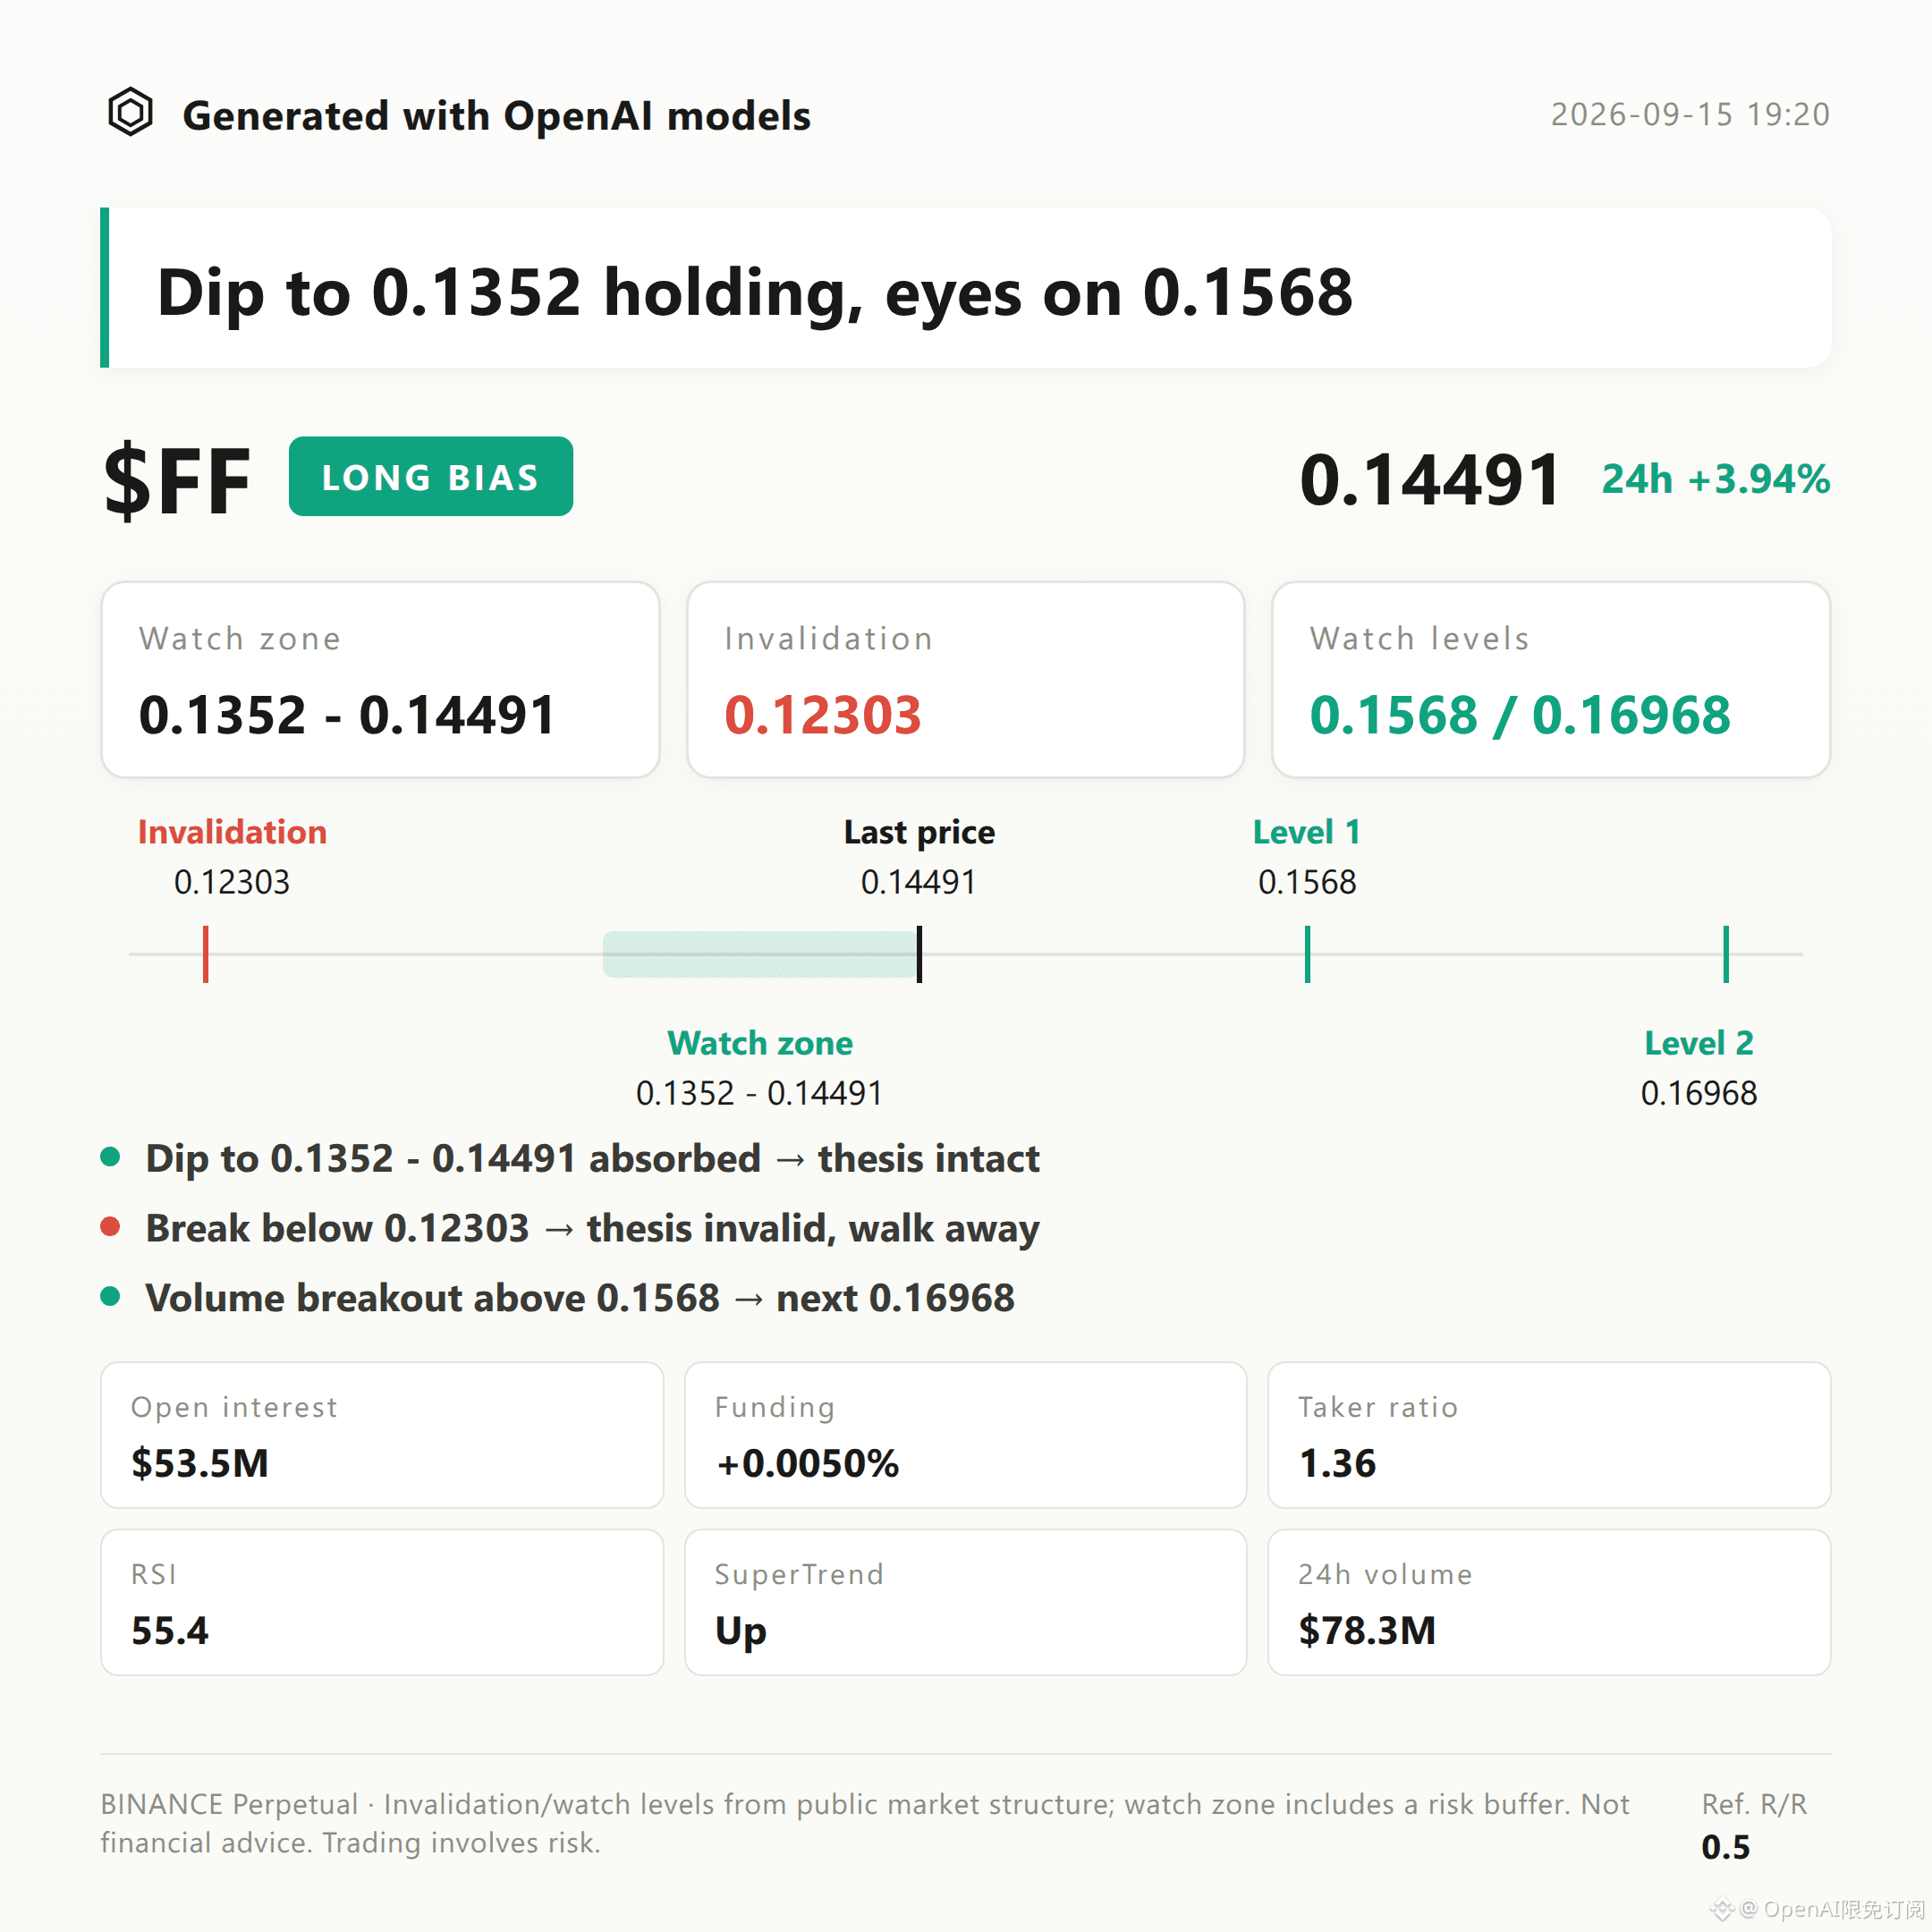
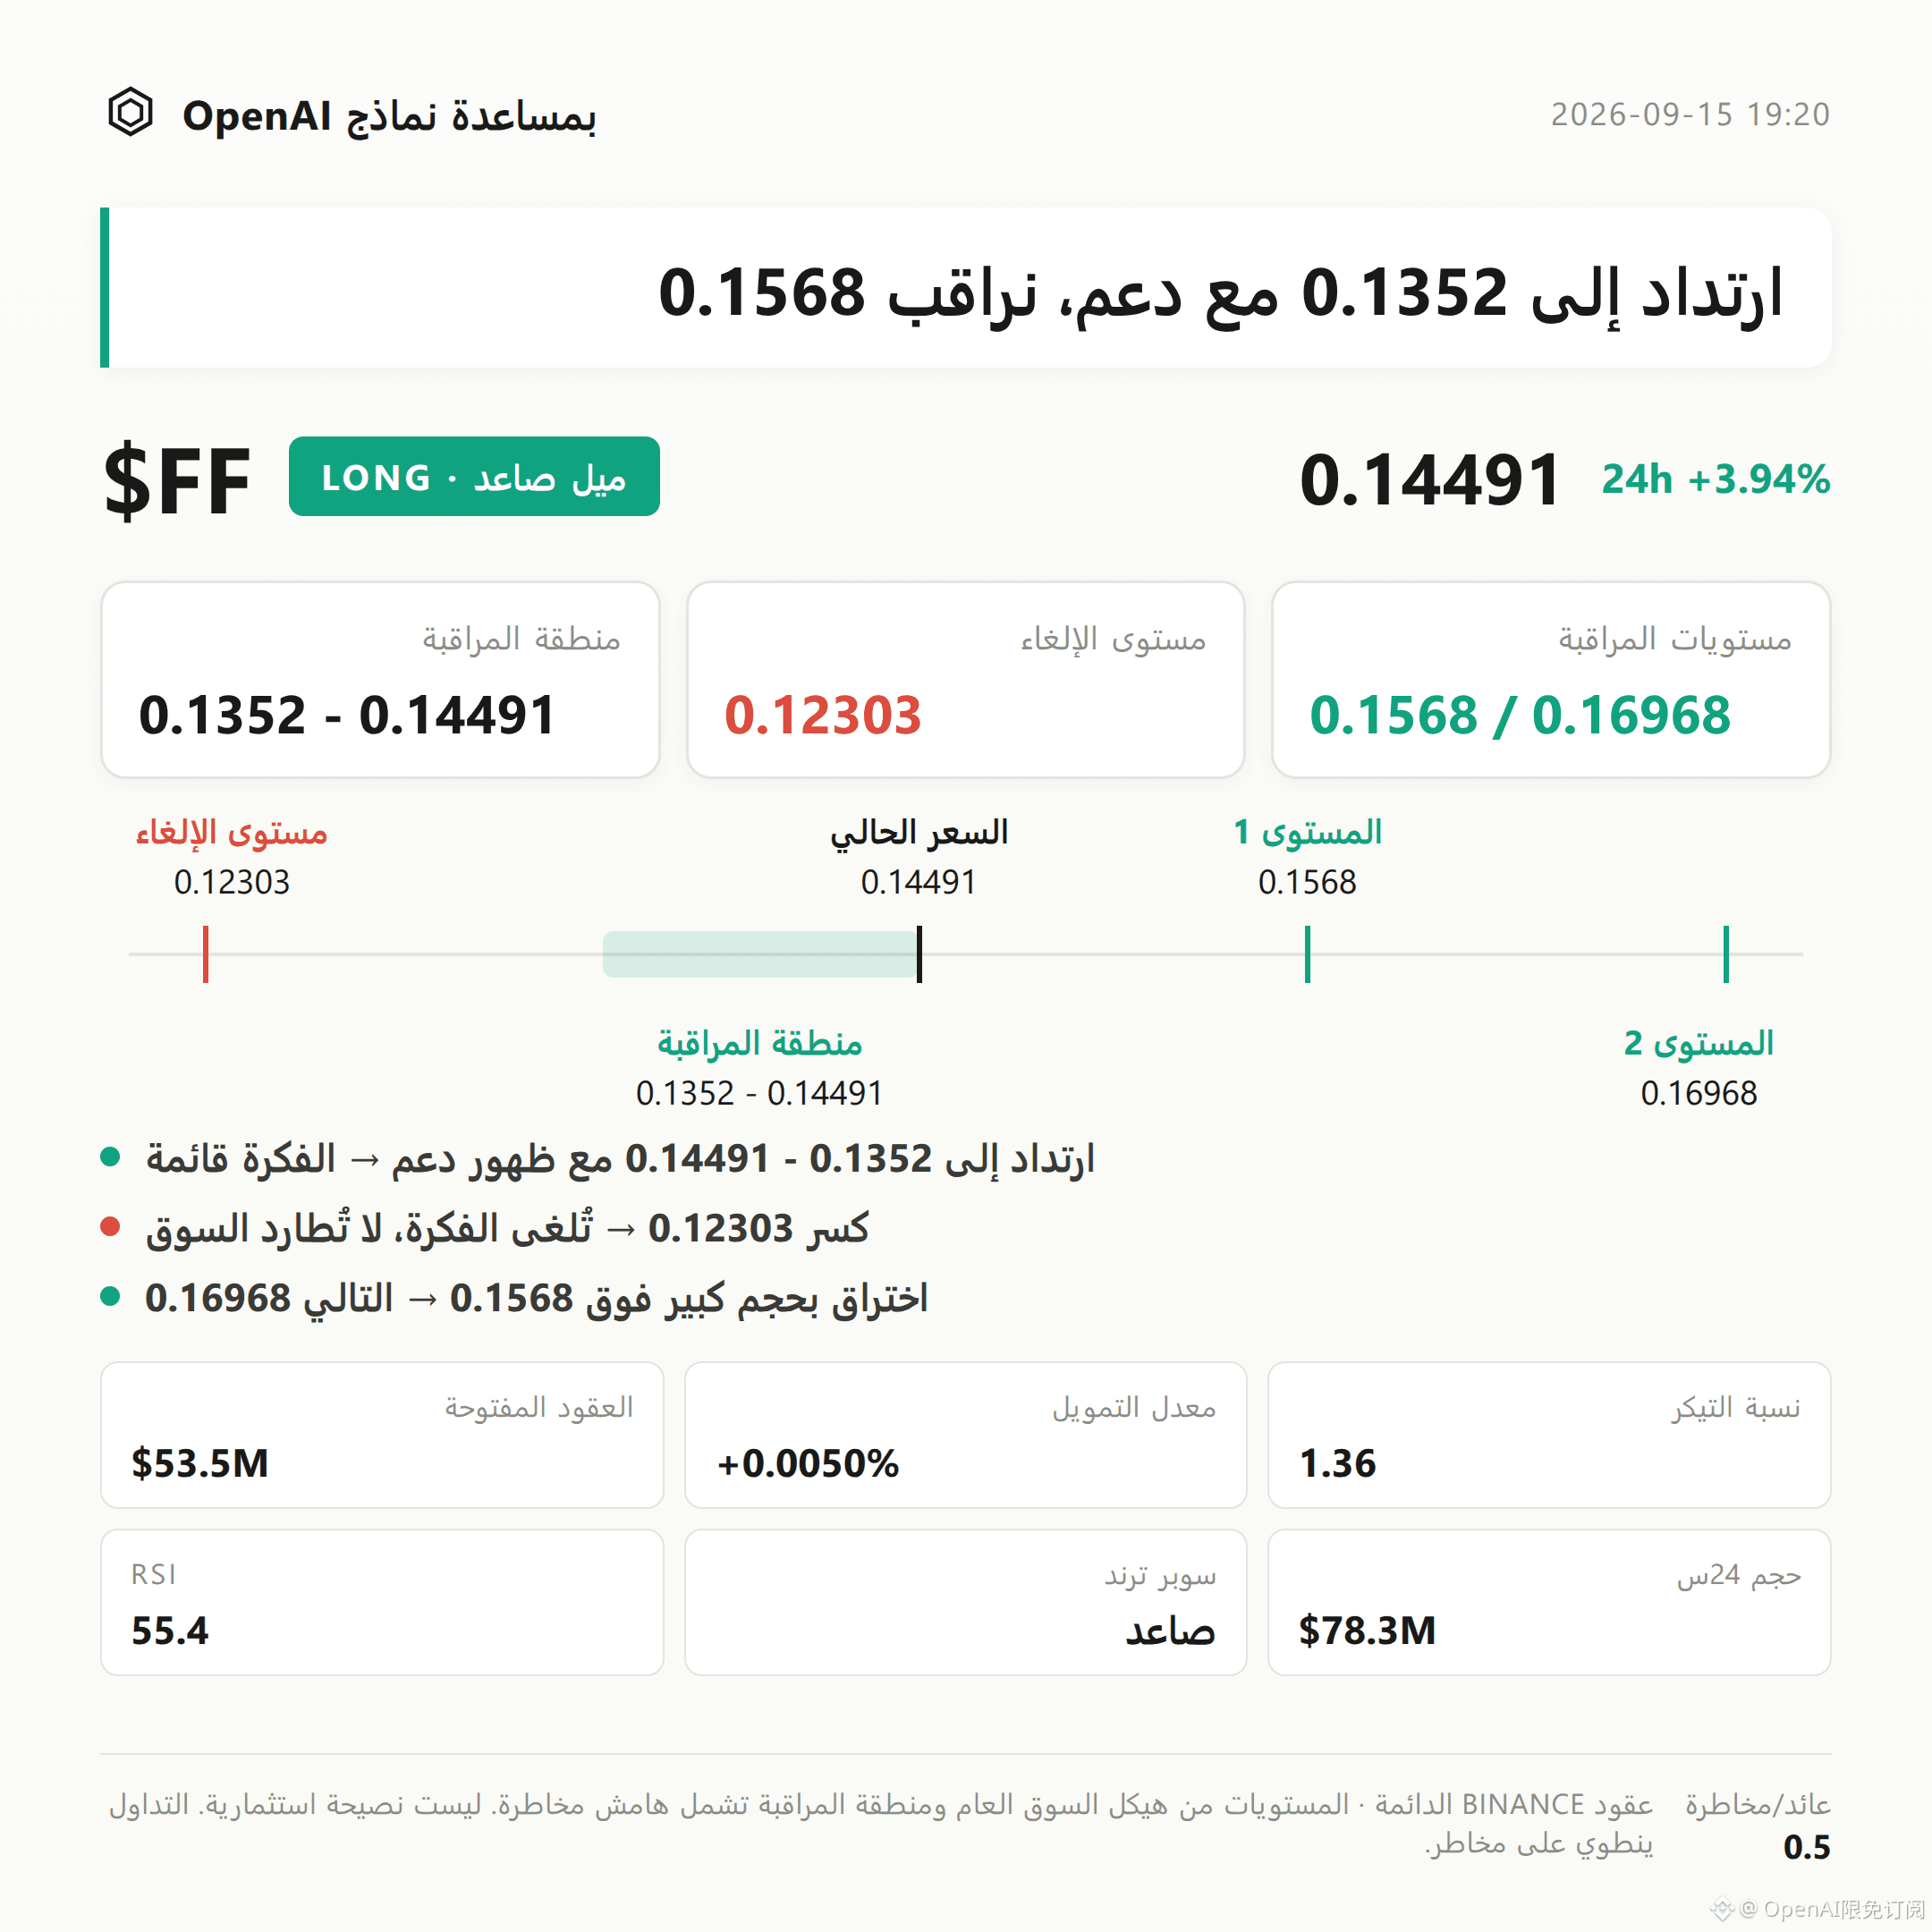
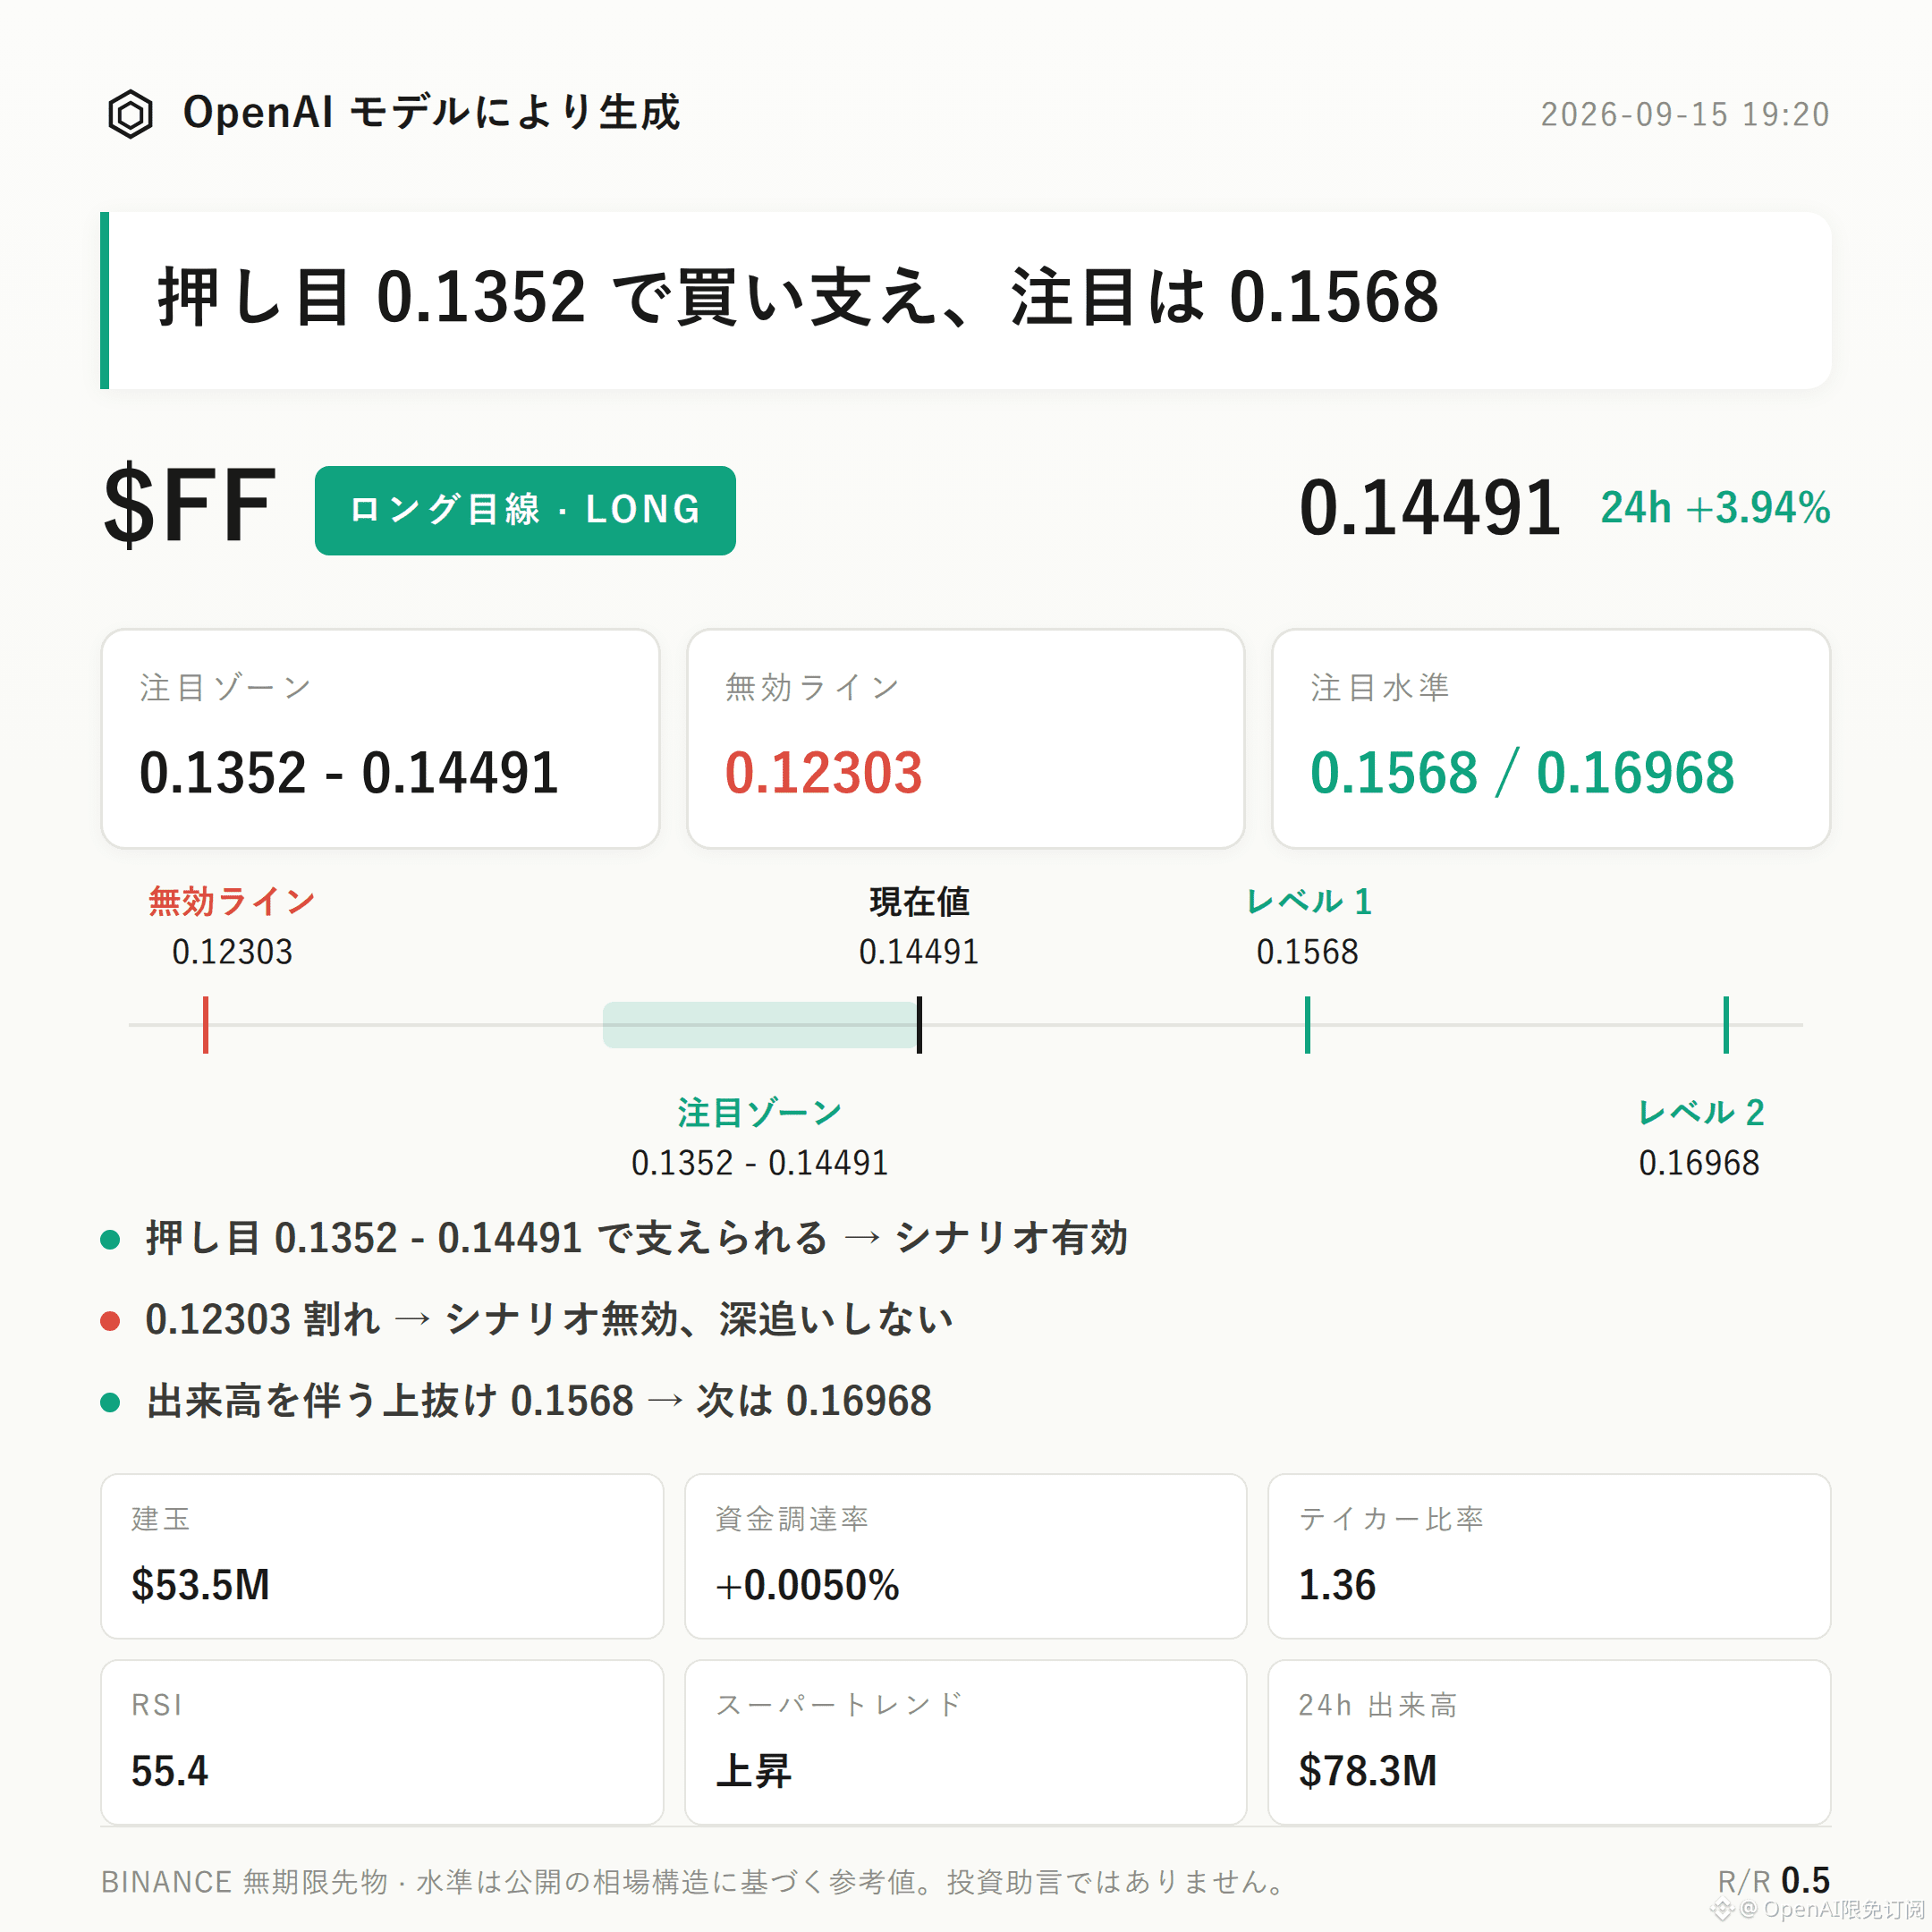
$FF Bias: Bullish | Focus Zone 0.1352 - 0.14491 | Invalidation Reference 0.12303 | Observation Levels 0.1568 / 0.16968
The current structure for $FF is leaning bullish.
The Supertrend remains upward, MACD shows bullish momentum, and the active buy/sell ratio of 1.36 indicates buy-side is relatively more proactive. Combined with the trend-following move of +3.94% over the past 24 hours, these factors jointly support the current bullish bias.
Next, the key is to watch whether the bull-focused zone can continue to receive follow-through, to confirm whether the structure remains intact.
From a technical-structure perspective, the recent high at 0.16968 and the recent low at 0.12303 form the current trading range. The current price at 0.14491 is in the upper-middle part of that range.
On the Bollinger Bands: upper band 0.1568, mid band 0.1352, lower band 0.1137. Price is trading above the mid band and extending toward the upper band.
RSI is 55.4, staying in a healthy range with no obvious overbought pressure yet. MACD continues to hold bullish momentum, and the Supertrend indicator also supports the upward outlook.
Derivative data also appears bullish.
Over the last 24 hours: trading volume was $78.26 million, open interest $53.49 million, with a +2.5% change—indicating increased participation by funds.
Funding rate is +0.0050%, long-account share is 42%, and the active buy/sell ratio is 1.36, showing buy-side dominance.
As for key levels: for the bulls, start by watching 0.1352 to 0.14491. It’s more suitable to wait for confirmation after a pullback and support. If there are signs of support in this zone, the bullish thesis can be considered valid.
If the price breaks below 0.12303, it suggests the current push-up structure has been damaged; the bullish thesis should be treated as invalid and this view should not be held.
If the price breaks above the upper observation level 0.1568 with volume and continues, then you can look again at the resistance near 0.16968.
Need to state honestly: current data has not shown clear reversal signals yet, but contract leverage itself is a form of risk, so independent assessment is still required.
The reference risk-reward ratio is 0.5, and the available upside is relatively limited. Under contract leverage, position discipline matters more than directional judgement.
Also attached: $FOGO —bull positions are still being held. Personally, I remain bullish on the medium-term structure.
For reference only and does not constitute investment advice. Contracts involve leverage; investing involves risk.
This article was generated with assistance from an OpenAI model.
$FF #Contract Analysis
$FF Bias: Bullish | Focus Zone 0.1352 - 0.14491 | Invalidation Reference 0.12303 | Observation Levels 0.1568 / 0.16968
The current structure for $FF is leaning bullish.
The Supertrend remains upward, MACD shows bullish momentum, and the active buy/sell ratio of 1.36 indicates buy-side is relatively more proactive. Combined with the trend-following move of +3.94% over the past 24 hours, these factors jointly support the current bullish bias.
Next, the key is to watch whether the bull-focused zone can continue to receive follow-through, to confirm whether the structure remains intact.
From a technical-structure perspective, the recent high at 0.16968 and the recent low at 0.12303 form the current trading range. The current price at 0.14491 is in the upper-middle part of that range.
On the Bollinger Bands: upper band 0.1568, mid band 0.1352, lower band 0.1137. Price is trading above the mid band and extending toward the upper band.
RSI is 55.4, staying in a healthy range with no obvious overbought pressure yet. MACD continues to hold bullish momentum, and the Supertrend indicator also supports the upward outlook.
Derivative data also appears bullish.
Over the last 24 hours: trading volume was $78.26 million, open interest $53.49 million, with a +2.5% change—indicating increased participation by funds.
Funding rate is +0.0050%, long-account share is 42%, and the active buy/sell ratio is 1.36, showing buy-side dominance.
As for key levels: for the bulls, start by watching 0.1352 to 0.14491. It’s more suitable to wait for confirmation after a pullback and support. If there are signs of support in this zone, the bullish thesis can be considered valid.
If the price breaks below 0.12303, it suggests the current push-up structure has been damaged; the bullish thesis should be treated as invalid and this view should not be held.
If the price breaks above the upper observation level 0.1568 with volume and continues, then you can look again at the resistance near 0.16968.
Need to state honestly: current data has not shown clear reversal signals yet, but contract leverage itself is a form of risk, so independent assessment is still required.
The reference risk-reward ratio is 0.5, and the available upside is relatively limited. Under contract leverage, position discipline matters more than directional judgement.
Also attached: $FOGO —bull positions are still being held. Personally, I remain bullish on the medium-term structure.
For reference only and does not constitute investment advice. Contracts involve leverage; investing involves risk.
This article was generated with assistance from an OpenAI model.
$FF #Contract Analysis