THE CHART EVERYONE'S SLEEPING ON — AND IT'S SCREAMING $250K.
Someone with under 500 followers just dropped the most important $BTC chart of the cycle. No hype. Just pure data.
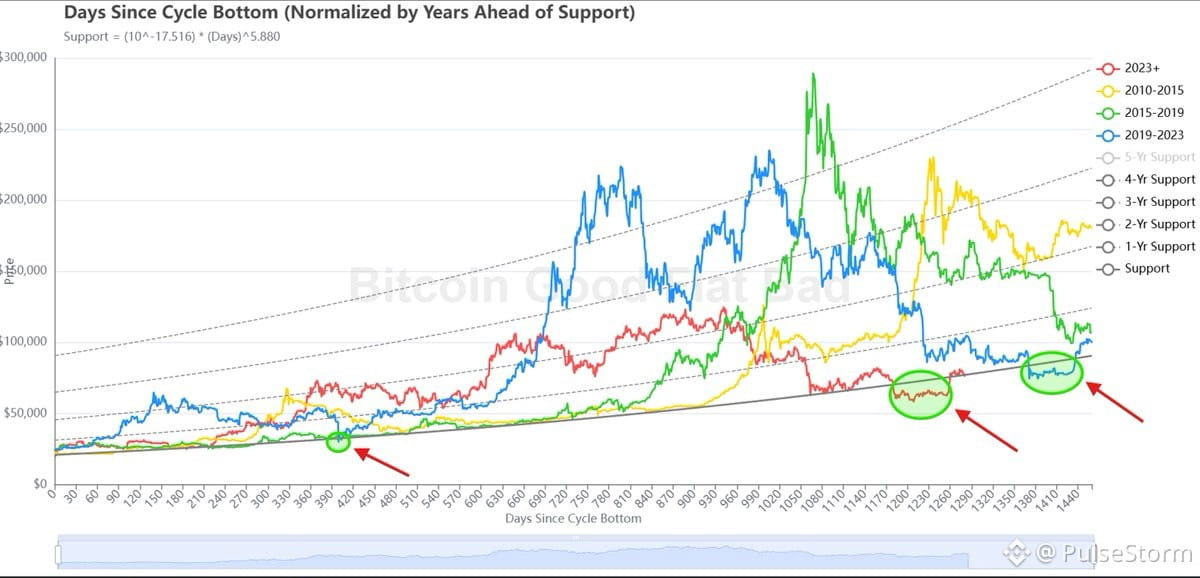
Every cycle normalized by days since the bottom. The circles mark every time price dipped below power law support — the exact zone we just bounced from at $58K.
And here's the kicker: every single time this happened, $BTC recovered violently and went parabolic.
This isn't hopium. It's pattern recognition.
Target: $250K.
The best analysis doesn't come from blue checks screaming into the void. It comes from builders quietly doing the work while everyone else chases clout.
Chart credit: @fiatbadbtcgood
If you're not watching power law support, you're trading blind. This is the setup. The question is whether you're positioned for the move.
Someone with under 500 followers just dropped the most important $BTC chart of the cycle. No hype. Just pure data.
Every cycle normalized by days since the bottom. The circles mark every time price dipped below power law support — the exact zone we just bounced from at $58K.
And here's the kicker: every single time this happened, $BTC recovered violently and went parabolic.
This isn't hopium. It's pattern recognition.
Target: $250K.
The best analysis doesn't come from blue checks screaming into the void. It comes from builders quietly doing the work while everyone else chases clout.
Chart credit: @fiatbadbtcgood
If you're not watching power law support, you're trading blind. This is the setup. The question is whether you're positioned for the move.