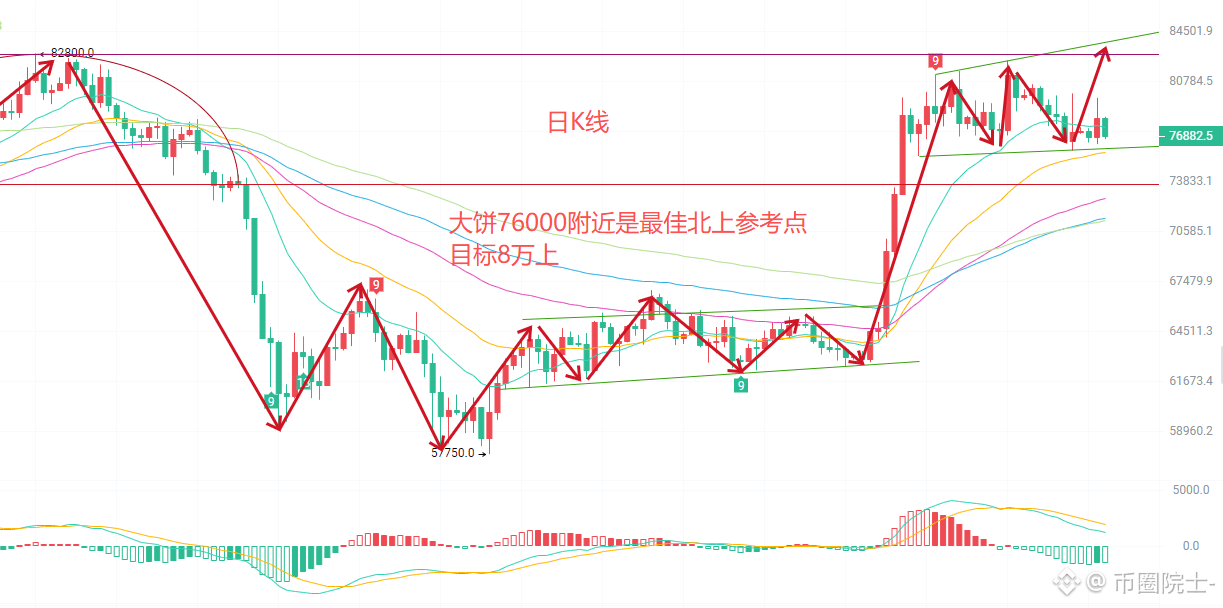
$BTC A daily candlestick chart hides the complete cycle of market sentiment. From the spike to the top, to the deep dip that formed the bottom, and then to the return of funds that pushed the price higher—after a steady rise, the current price 76900 is now in a high-level consolidation.
The market always tops out in consensus and advances through divergence. When the market surges, everyone is bullish; when it pulls back, everyone panics together. Most people are led by the emotions on the board, ignoring structural signals from the bigger cycle.
Technical indicators are just tools; understanding funds and sentiment is the core. Learn from studying the order flow and learn to wait and maintain respect—it matters far more than chasing short-term volatility. We will keep sharing candlestick chart reviews and slowly refine our ability to read the market together.#BTC走势分析
The market always tops out in consensus and advances through divergence. When the market surges, everyone is bullish; when it pulls back, everyone panics together. Most people are led by the emotions on the board, ignoring structural signals from the bigger cycle.
Technical indicators are just tools; understanding funds and sentiment is the core. Learn from studying the order flow and learn to wait and maintain respect—it matters far more than chasing short-term volatility. We will keep sharing candlestick chart reviews and slowly refine our ability to read the market together.#BTC走势分析