SUIUSDT – Bullish Triangle Breakout Confirmed | Resistance
#SUI
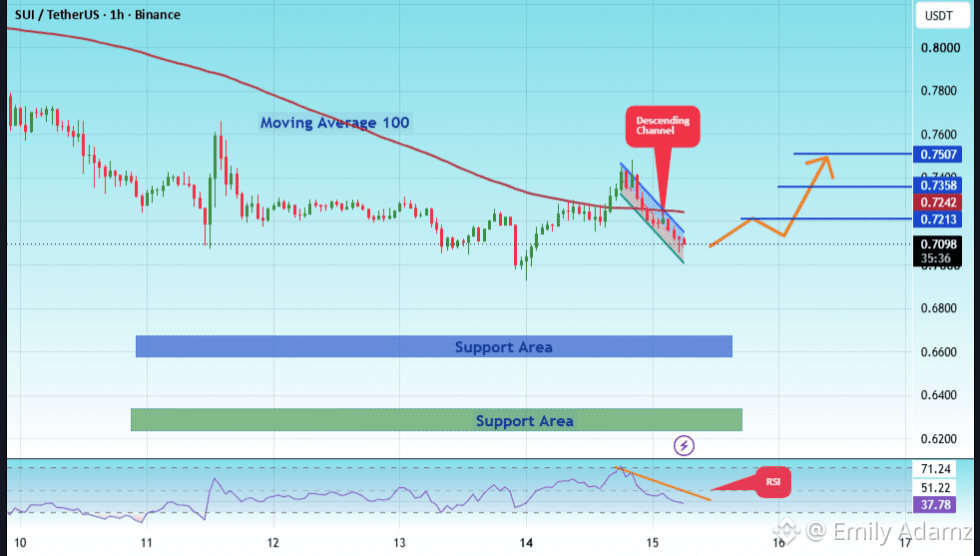
The price is moving within a descending channel on the 1-hour timeframe; it has reached the lower boundary and is poised for a rebound. A retest of this boundary is expected, supporting an upward move.
The Relative Strength Index (RSI) indicates a bearish trend, but an upward breakout is likely due to oversold conditions on the 1-hour chart.
There is initial support at the 0.6600 level.
A key support zone (marked in green) exists at 0.6200; the price has bounced off this area multiple times, making it a strong support level.
The price is moving toward the 100-period moving average, which is within close range; this supports a potential rise.
Entry Price: 0.7100
Target 1: 0.7213
Target 2: 0.7362
Target 3: 0.7507
Stop Loss: At the green resistance zone.
Remember this simple rule: Capital management
.
$SUI #SUI🔥
#SUI
The price is moving within a descending channel on the 1-hour timeframe; it has reached the lower boundary and is poised for a rebound. A retest of this boundary is expected, supporting an upward move.
The Relative Strength Index (RSI) indicates a bearish trend, but an upward breakout is likely due to oversold conditions on the 1-hour chart.
There is initial support at the 0.6600 level.
A key support zone (marked in green) exists at 0.6200; the price has bounced off this area multiple times, making it a strong support level.
The price is moving toward the 100-period moving average, which is within close range; this supports a potential rise.
Entry Price: 0.7100
Target 1: 0.7213
Target 2: 0.7362
Target 3: 0.7507
Stop Loss: At the green resistance zone.
Remember this simple rule: Capital management
.
$SUI #SUI🔥