Trading Thesis|9/15 15:21
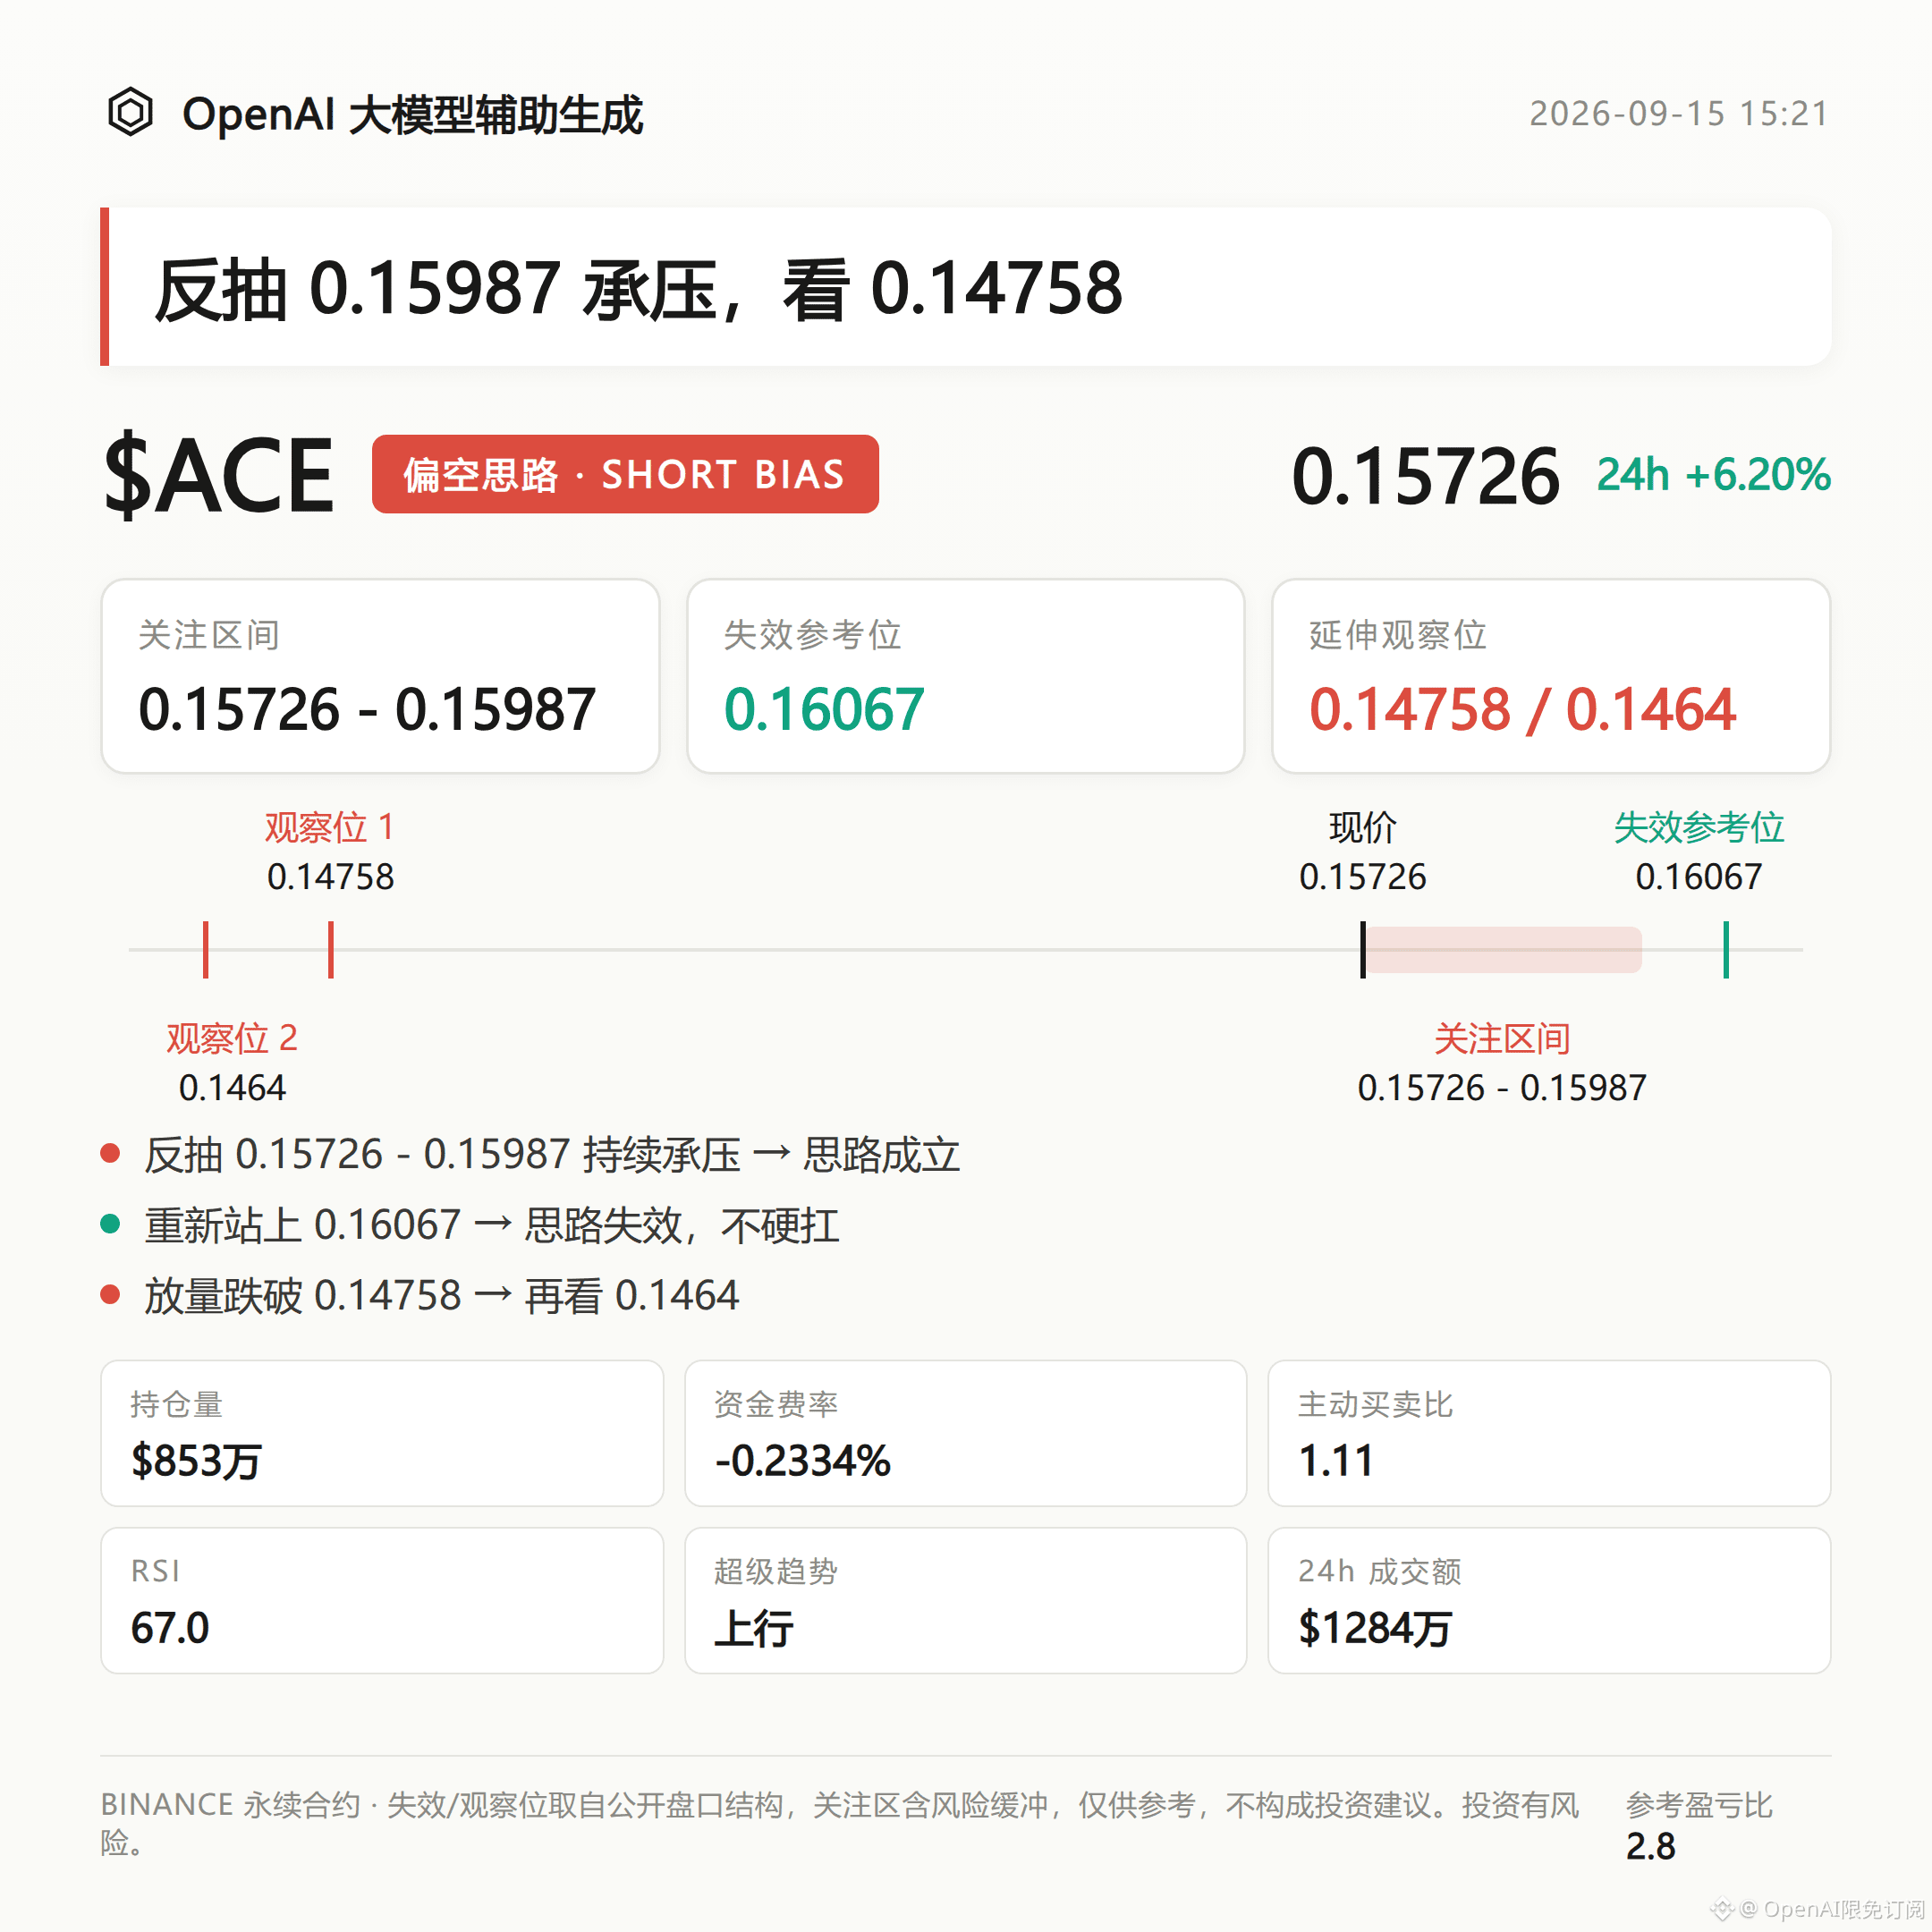
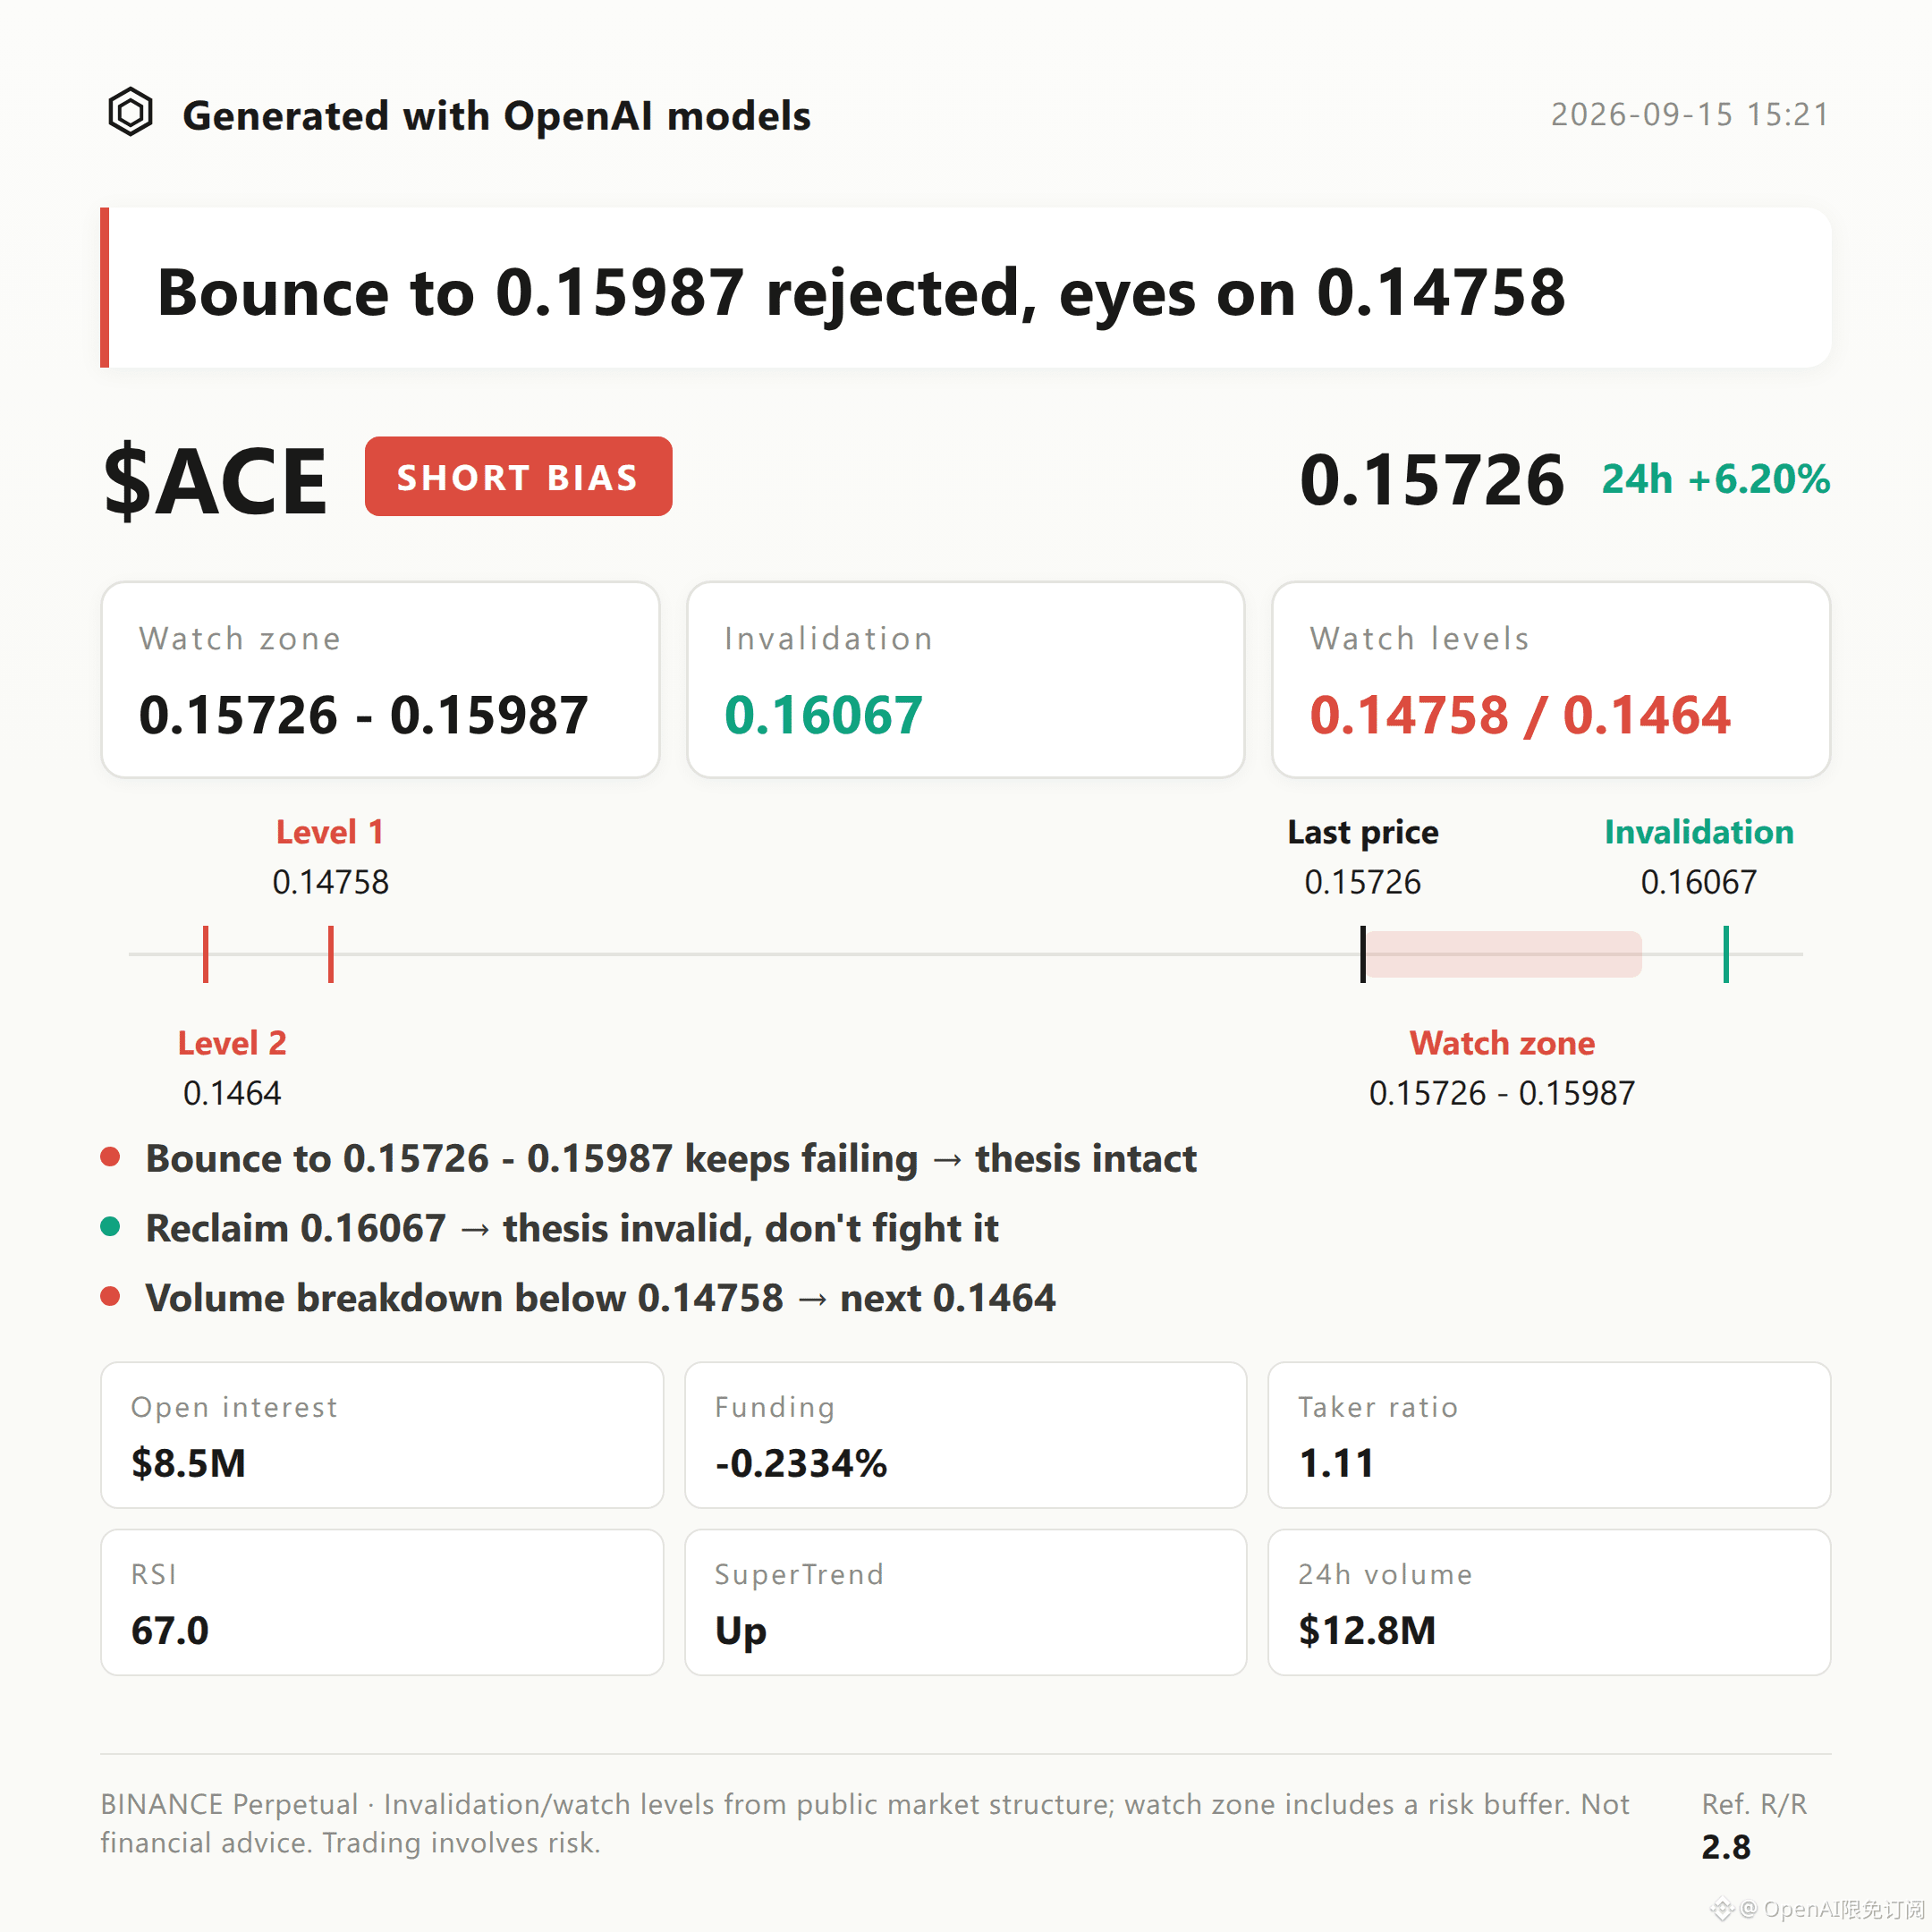
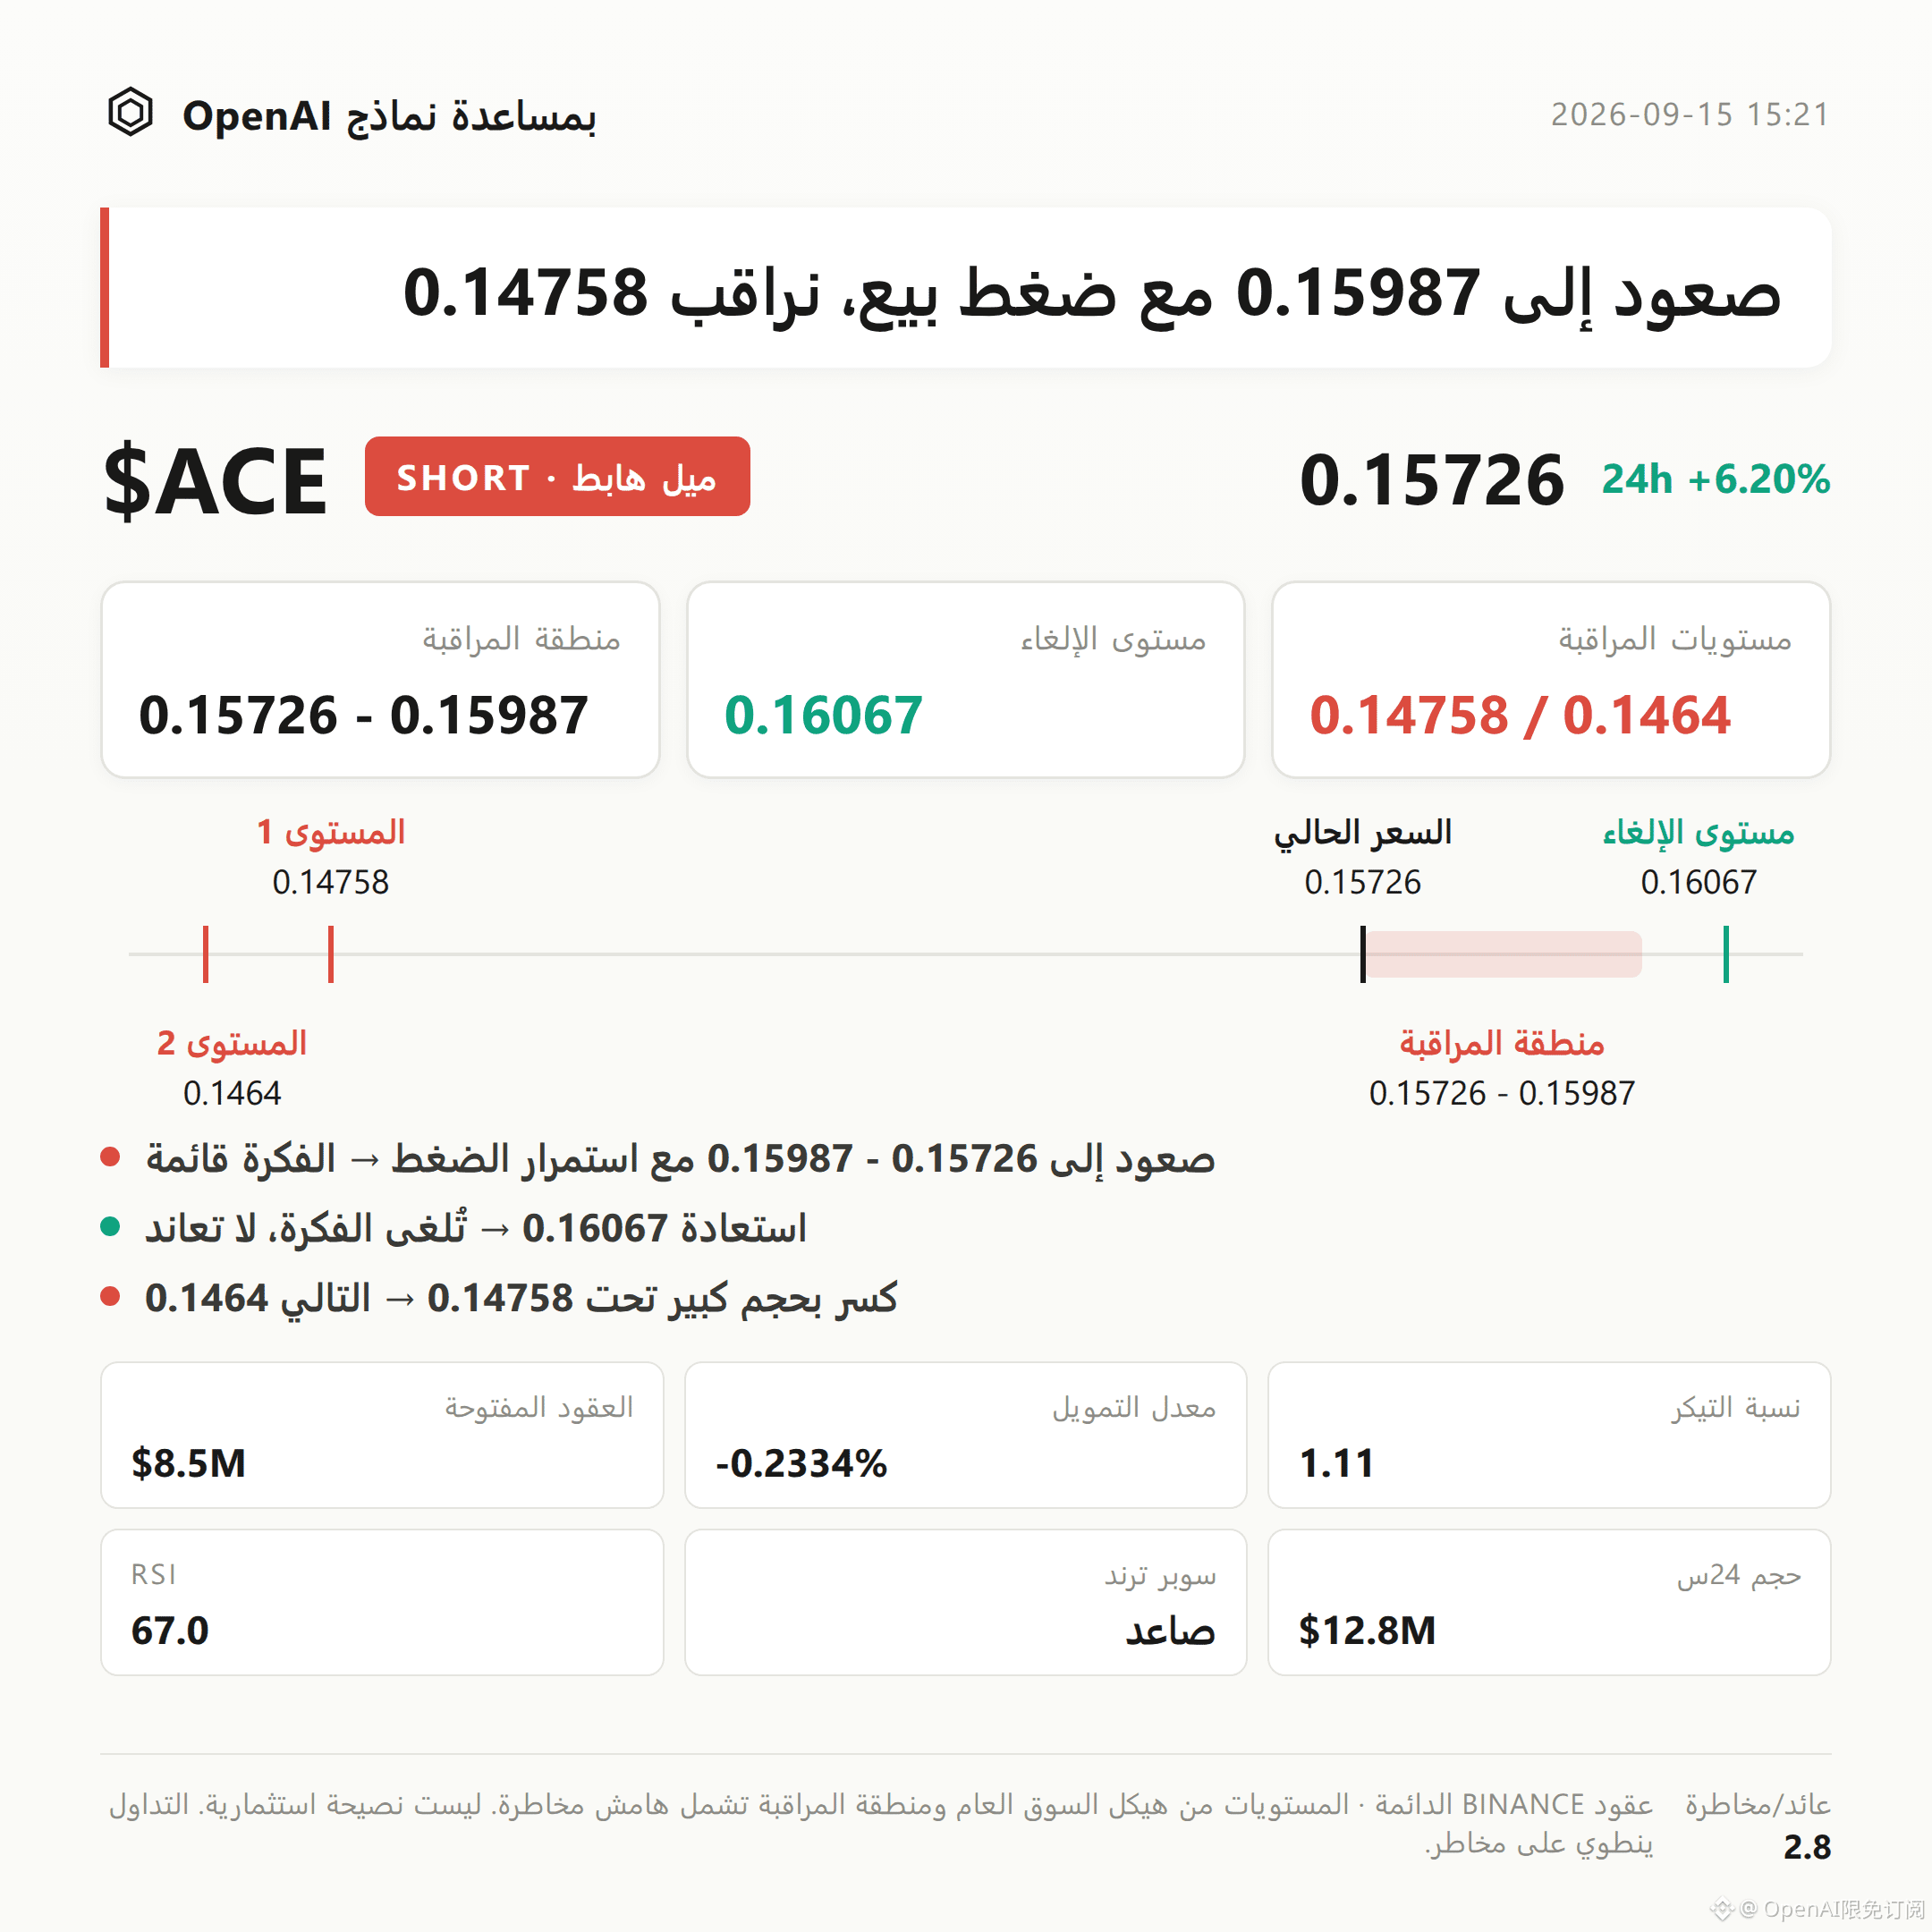
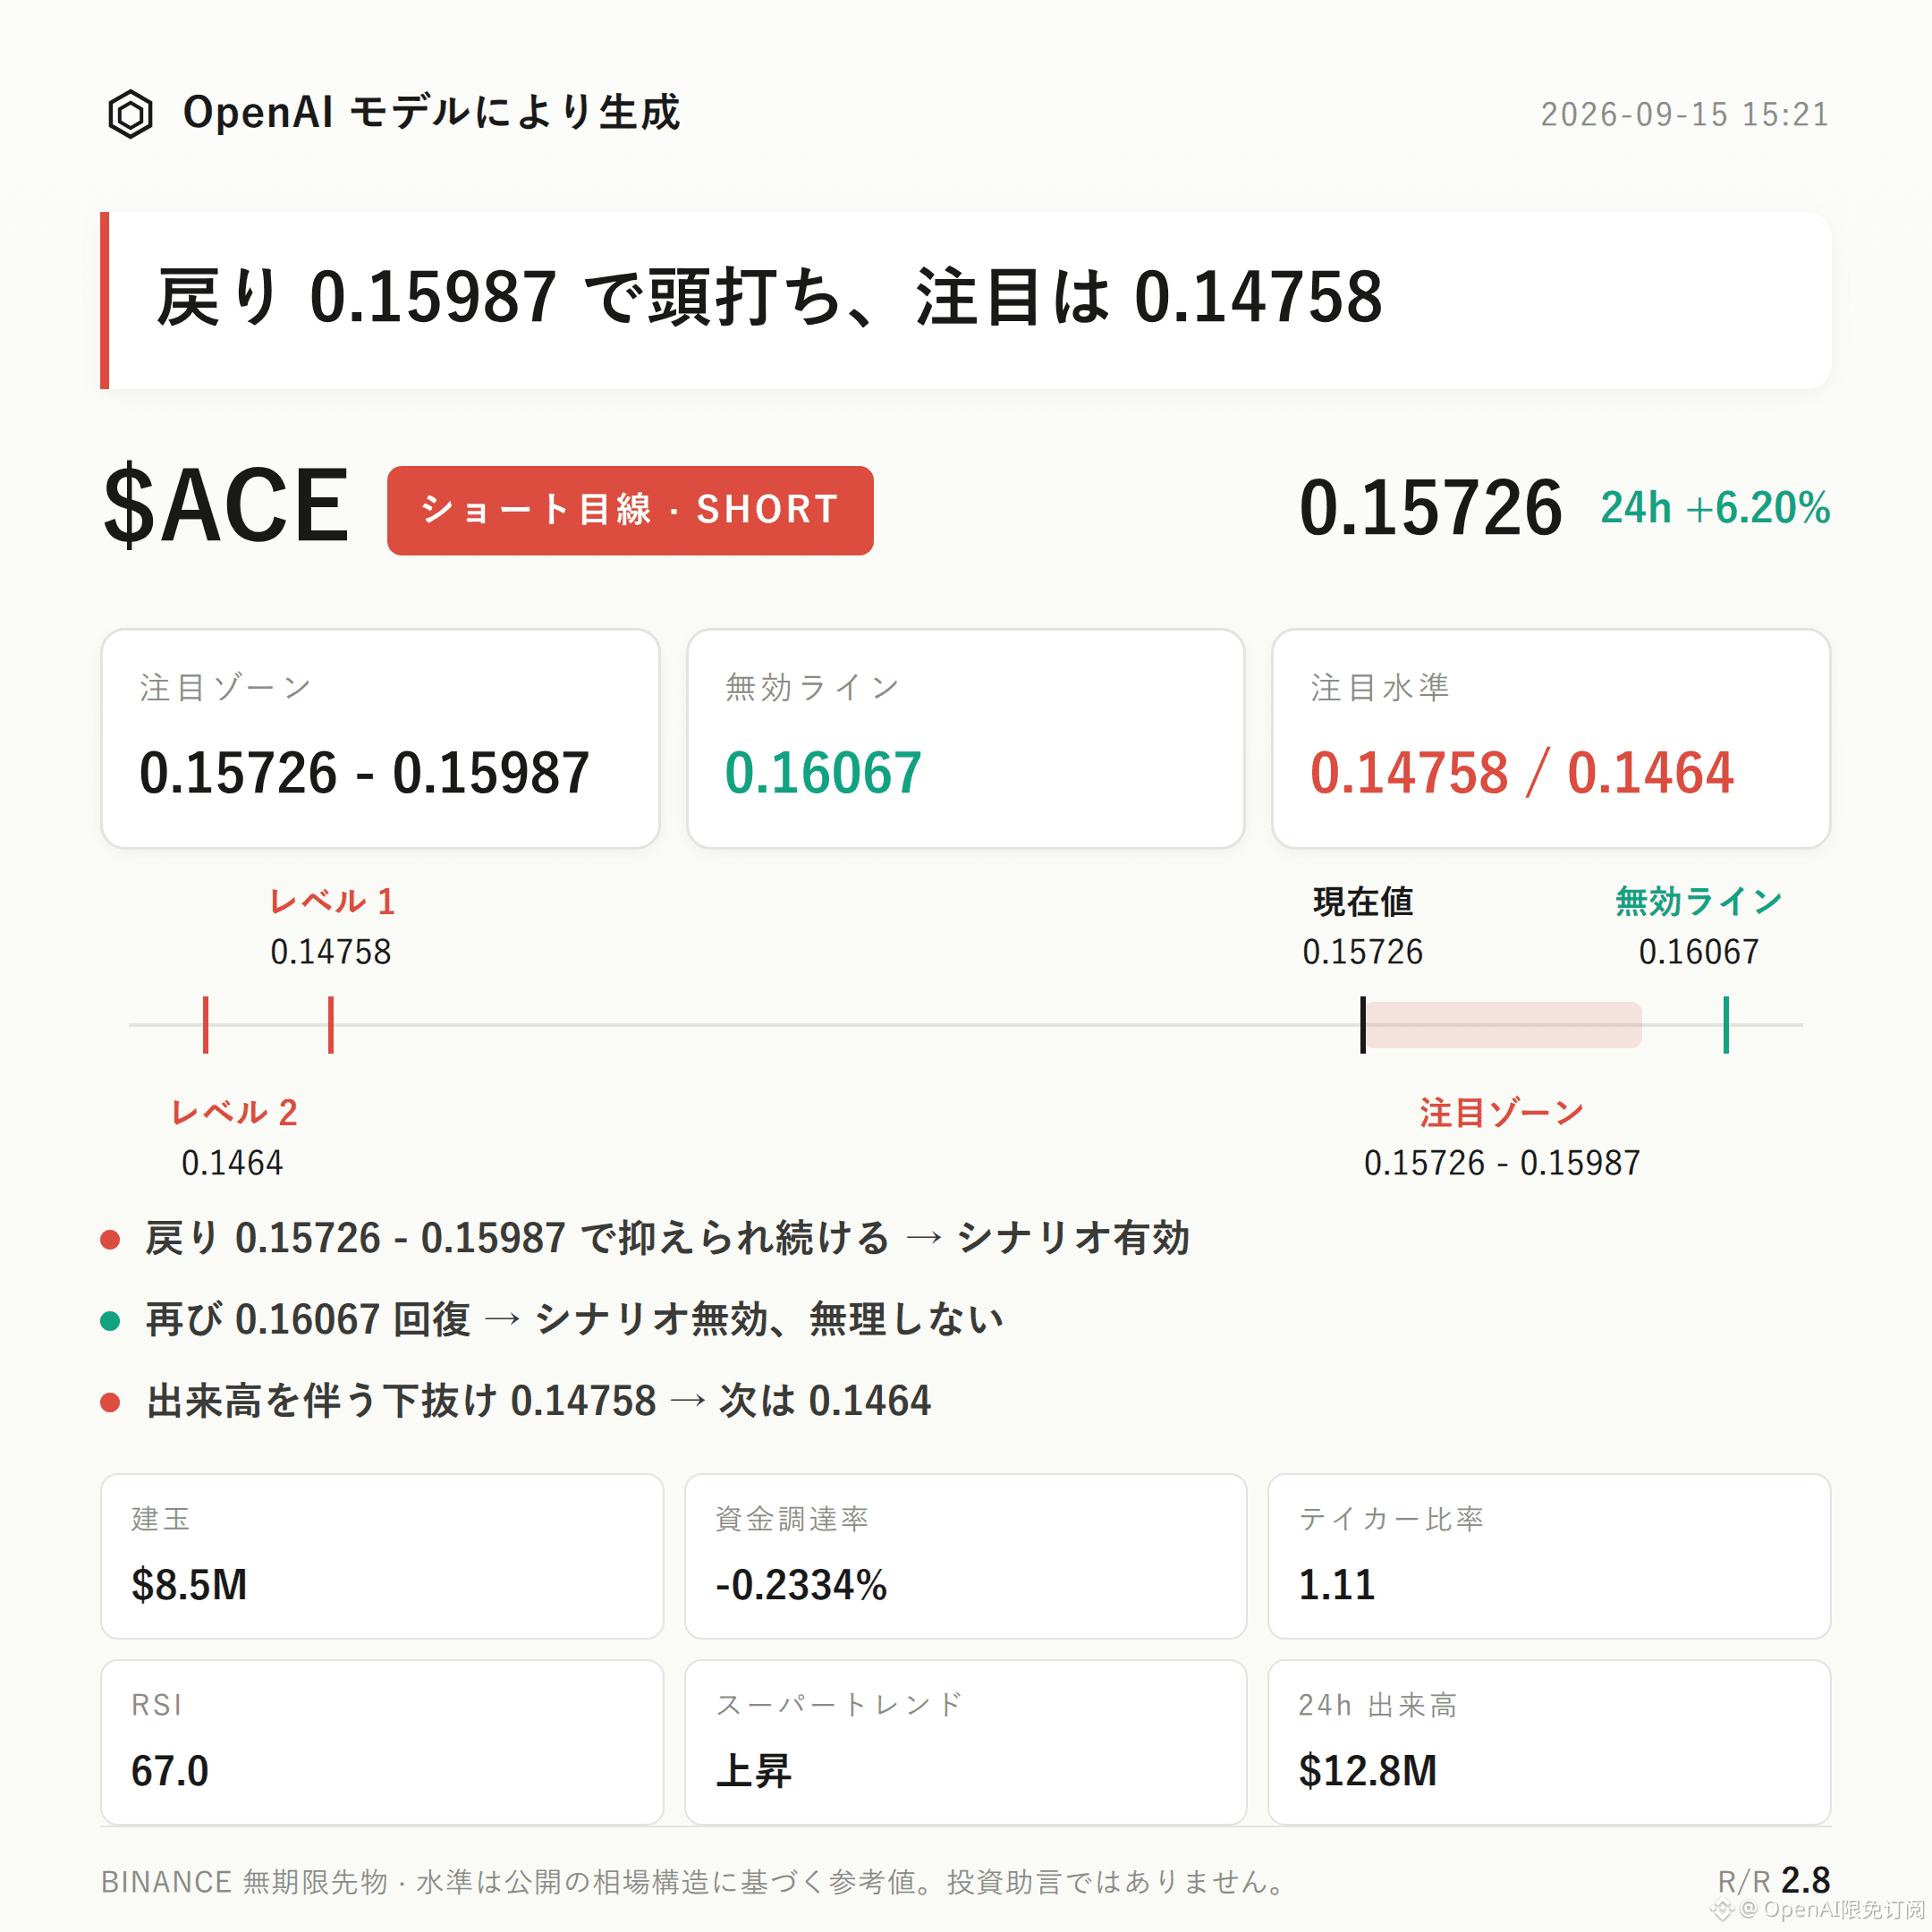
$ACE bearish-leaning approach | Watch zone 0.15726 - 0.15987 | Invalidation reference 0.16067 | Observation levels 0.14758 / 0.1464
$ACE ’s current bearish-leaning structure is unfolding.
Key argument: The current price, 0.15726, has already moved above the upper Bollinger Band at 0.1561; the RSI has reached a relatively high 67.0 level; and it is just one step away from the recent high at 0.16067. Meanwhile, the 24-hour trading volume increased by 9.3% and the funding rate turned negative in tandem, indicating that within short-term positions, the share of newly added shorts is rising—suggesting the market is showing signs of overheating.
Validation method: Focus on whether, after price returns into the 0.15726-0.15987 range, it can be kept under pressure and capped, or whether it instead rebounds directly and breaks through.
Recent high: 0.16067; recent low: 0.14758; the current price at 0.15726 is in the upper half of the range, with limited upside room to the previous high.
Bollinger Bands: upper 0.1561, mid 0.1513, lower 0.1464. Price is already running above the upper band, implying an overextension/overbought condition in the short term.
RSI is 67.0—high, though it has not yet entered a “deadening/extreme” zone.
Need to state this objectively: MACD is still indicating bullish momentum, and the SuperTrend indicator continues to support an upward judgment. These two medium-term momentum indicators have not yet turned—these are the most direct contrary signals to this bearish thesis. If they weaken in sync, the bearish logic becomes more solid; if they keep strengthening, this thesis should be handled more cautiously.
24-hour trading value is about $12.84 million; open interest is about $8.53 million. Open interest increased by 9.3% over 24 hours—this is not a small expansion.
Funding rate is -0.2334%. The short side is paying funding on its positions, which suggests short-term shorts are already fairly concentrated. This, by itself, is a positioning “crowding” signal. The risk section below will elaborate further.
Regarding long/short account ratio: longs are 44%; structurally there are more accounts on the short side.
The buy/sell ratio is 1.11—active buy orders are slightly stronger than sell orders. This item is not fully consistent with the bearish direction, so list it as-is as well.
For the bearish watch zone, first look at 0.15726-0.15987. It is more suitable to wait for a lack of follow-through/weakening pressure (滞涨 or承压走弱) within this zone before confirming, rather than treating entry into the zone as the conclusion.
If, after a rebound into the watch zone, price is indeed capped and held down, the bearish structure can continue to be monitored according to the original thesis.
Place the invalidation reference at 0.16067. If price re-establishes and stays above this level, it would mean the current pullback structure is broken, the bearish thesis is invalid, and it would not be advisable to keep fighting/lingering on the short side.
For the downside extension observation level, watch 0.14758. If a high-volume breakdown occurs, then assess support around 0.1464. Whether selling pressure can be stopped and trend stabilizes will depend on how that level is being absorbed.
Must-flag reverse risk: Funding rate is -0.2334% and shorts are already fairly crowded. If price rebounds, there is a risk of a squeeze-like rally. Don’t focus on shorts one-sidedly.
Also, over the last 24 hours, the price has already risen 6.20%. MACD and SuperTrend are still pointing to the bullish direction at present.
$ACE bearish-leaning approach | Watch zone 0.15726 - 0.15987 | Invalidation reference 0.16067 | Observation levels 0.14758 / 0.1464
$ACE ’s current bearish-leaning structure is unfolding.
Key argument: The current price, 0.15726, has already moved above the upper Bollinger Band at 0.1561; the RSI has reached a relatively high 67.0 level; and it is just one step away from the recent high at 0.16067. Meanwhile, the 24-hour trading volume increased by 9.3% and the funding rate turned negative in tandem, indicating that within short-term positions, the share of newly added shorts is rising—suggesting the market is showing signs of overheating.
Validation method: Focus on whether, after price returns into the 0.15726-0.15987 range, it can be kept under pressure and capped, or whether it instead rebounds directly and breaks through.
Recent high: 0.16067; recent low: 0.14758; the current price at 0.15726 is in the upper half of the range, with limited upside room to the previous high.
Bollinger Bands: upper 0.1561, mid 0.1513, lower 0.1464. Price is already running above the upper band, implying an overextension/overbought condition in the short term.
RSI is 67.0—high, though it has not yet entered a “deadening/extreme” zone.
Need to state this objectively: MACD is still indicating bullish momentum, and the SuperTrend indicator continues to support an upward judgment. These two medium-term momentum indicators have not yet turned—these are the most direct contrary signals to this bearish thesis. If they weaken in sync, the bearish logic becomes more solid; if they keep strengthening, this thesis should be handled more cautiously.
24-hour trading value is about $12.84 million; open interest is about $8.53 million. Open interest increased by 9.3% over 24 hours—this is not a small expansion.
Funding rate is -0.2334%. The short side is paying funding on its positions, which suggests short-term shorts are already fairly concentrated. This, by itself, is a positioning “crowding” signal. The risk section below will elaborate further.
Regarding long/short account ratio: longs are 44%; structurally there are more accounts on the short side.
The buy/sell ratio is 1.11—active buy orders are slightly stronger than sell orders. This item is not fully consistent with the bearish direction, so list it as-is as well.
For the bearish watch zone, first look at 0.15726-0.15987. It is more suitable to wait for a lack of follow-through/weakening pressure (滞涨 or承压走弱) within this zone before confirming, rather than treating entry into the zone as the conclusion.
If, after a rebound into the watch zone, price is indeed capped and held down, the bearish structure can continue to be monitored according to the original thesis.
Place the invalidation reference at 0.16067. If price re-establishes and stays above this level, it would mean the current pullback structure is broken, the bearish thesis is invalid, and it would not be advisable to keep fighting/lingering on the short side.
For the downside extension observation level, watch 0.14758. If a high-volume breakdown occurs, then assess support around 0.1464. Whether selling pressure can be stopped and trend stabilizes will depend on how that level is being absorbed.
Must-flag reverse risk: Funding rate is -0.2334% and shorts are already fairly crowded. If price rebounds, there is a risk of a squeeze-like rally. Don’t focus on shorts one-sidedly.
Also, over the last 24 hours, the price has already risen 6.20%. MACD and SuperTrend are still pointing to the bullish direction at present.