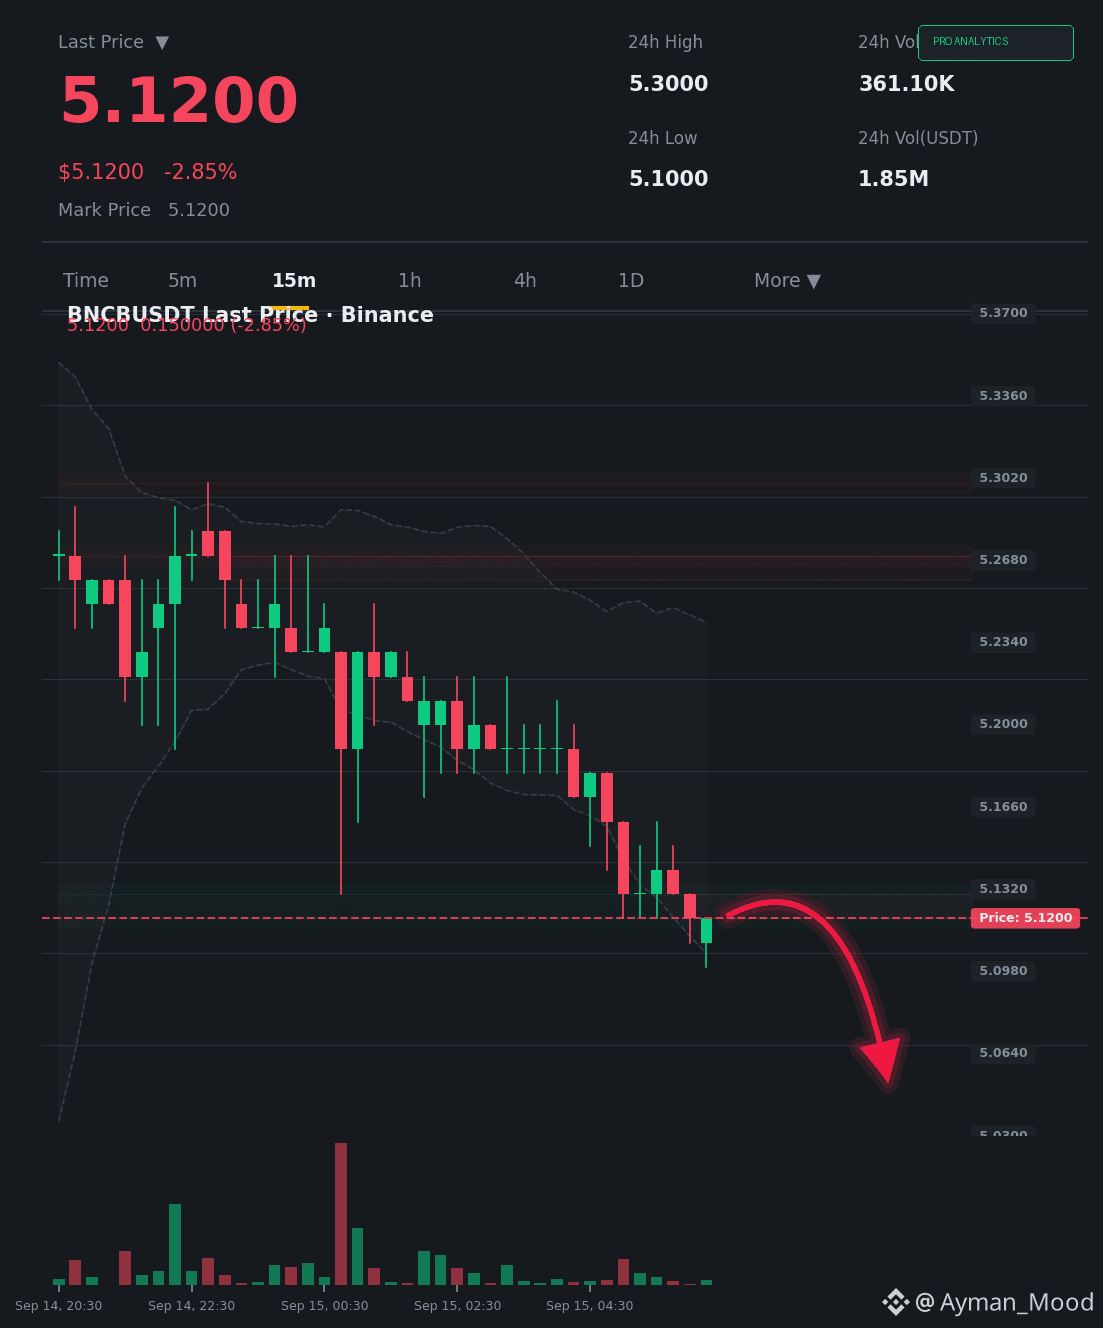
$BNCB The price drops 8.73% with near-zero liquidity (0.06x) — are we looking at a liquidity trap or the start of a trend?
The price is at $5.12, and the sharp decline accompanied by a collapse in trading volume indicates the absence of real sellers rather than their strength. The bearish candles on the 15-minute timeframe show long lower “wicks,” revealing absorption-driven buying at these levels. The lack of genuine selling momentum reduces the likelihood of the aggressive sell-off continuing.
The most likely scenario: a technical corrective rebound toward the $5.30 – $5.40 area to retest the moving averages, provided the price holds above the current session’s low. A confirmed breakdown to the downside requires much higher trading volume than what we are seeing right now.
Follow us for more precise analyses and clearer opportunities
$BNCB
This content is not investment advice—do your own research (DYOR)
The price is at $5.12, and the sharp decline accompanied by a collapse in trading volume indicates the absence of real sellers rather than their strength. The bearish candles on the 15-minute timeframe show long lower “wicks,” revealing absorption-driven buying at these levels. The lack of genuine selling momentum reduces the likelihood of the aggressive sell-off continuing.
The most likely scenario: a technical corrective rebound toward the $5.30 – $5.40 area to retest the moving averages, provided the price holds above the current session’s low. A confirmed breakdown to the downside requires much higher trading volume than what we are seeing right now.
Follow us for more precise analyses and clearer opportunities
$BNCB
This content is not investment advice—do your own research (DYOR)