$BTC ⚔️ HOUR ANALYSIS — BTC/USDT 🤳🎯🚀
📊 Timeframe: 1H | Bitcoin
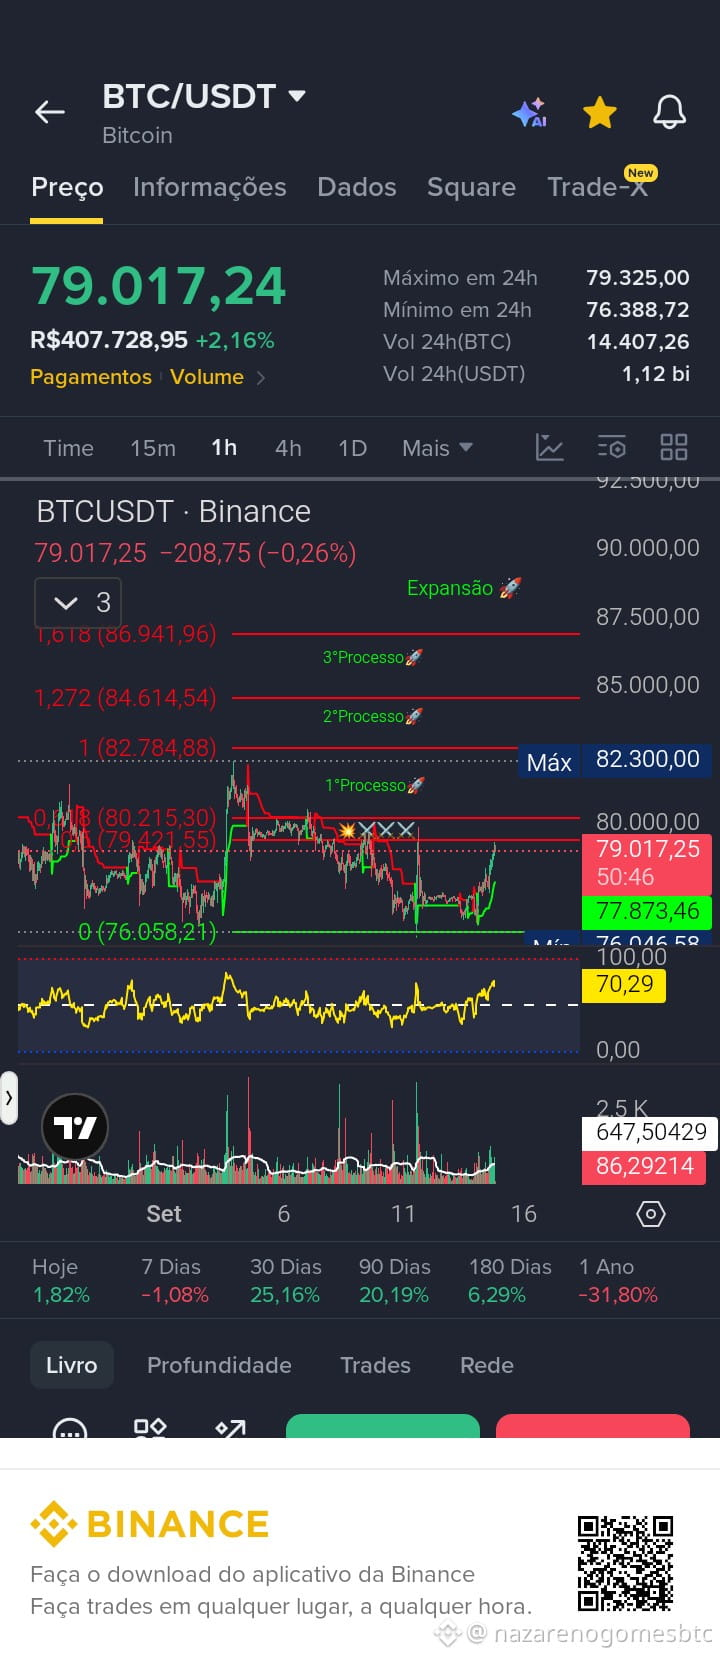
Bitcoin shows recovery after testing the support region near $76,000. On the chart, the price is at $79,017, showing buying strength, but it still needs to confirm the breakout of resistances to move forward with the Fibonacci projection.
🎯 FIBONACCI PROJECTION — EXPANSION
1st Process 🚀
0.5: $79,421.55
0.618: $80,215.30
1.0: $82,784.88
2nd Process 🚀
1.272: $84,614.54
3rd Process 🚀
1.618: $86,941.96
The $82,300 region is the highest point marked on the chart and represents an important resistance for the continuation of the expansion.
📈 TECHNICAL READ
The price is reacting positively, with RSI at approximately 70, indicating buying strength and also attention for a possible profit-taking move.
However, the recovery still needs confirmation. A break above $79,421 may open the way to $80,215. Above that area, the market gains room to seek $82,785.
🛡️ SUPPORTS AND INVALIDATION
$77,873: immediate support.
$76,058: main projection support.
Loss of $76,058: weakens the recovery structure and raises the possibility of seeking lower supports.
⚔️ TRADING PLAN
Buy: wait for a confirmed breakout of $79,421 or a bullish reaction at support, with risk management.
Targets: $80,215 → $82,785 → $84,615 → $86,942.
Stop: below support!
⚠️ The projection is not a guarantee of upside. The price may fluctuate, take profits, and test supports before continuing. What matters is to follow the process, not chase the price.
🔥 CONCLUSION
Bitcoin is in recovery, but confirmation of the expansion depends on overcoming resistances. Fibonacci organizes the targets; price, volume, and candle behavior help validate the entry.
Confidence in the analysis + persistence + attitude = progress in trading. 💪
📊 Follow the process! 💥🚀
⚔️ Trader Sniper Community 🤳🎯
Follow, share, and leave your like
📊 Timeframe: 1H | Bitcoin
Bitcoin shows recovery after testing the support region near $76,000. On the chart, the price is at $79,017, showing buying strength, but it still needs to confirm the breakout of resistances to move forward with the Fibonacci projection.
🎯 FIBONACCI PROJECTION — EXPANSION
1st Process 🚀
0.5: $79,421.55
0.618: $80,215.30
1.0: $82,784.88
2nd Process 🚀
1.272: $84,614.54
3rd Process 🚀
1.618: $86,941.96
The $82,300 region is the highest point marked on the chart and represents an important resistance for the continuation of the expansion.
📈 TECHNICAL READ
The price is reacting positively, with RSI at approximately 70, indicating buying strength and also attention for a possible profit-taking move.
However, the recovery still needs confirmation. A break above $79,421 may open the way to $80,215. Above that area, the market gains room to seek $82,785.
🛡️ SUPPORTS AND INVALIDATION
$77,873: immediate support.
$76,058: main projection support.
Loss of $76,058: weakens the recovery structure and raises the possibility of seeking lower supports.
⚔️ TRADING PLAN
Buy: wait for a confirmed breakout of $79,421 or a bullish reaction at support, with risk management.
Targets: $80,215 → $82,785 → $84,615 → $86,942.
Stop: below support!
⚠️ The projection is not a guarantee of upside. The price may fluctuate, take profits, and test supports before continuing. What matters is to follow the process, not chase the price.
🔥 CONCLUSION
Bitcoin is in recovery, but confirmation of the expansion depends on overcoming resistances. Fibonacci organizes the targets; price, volume, and candle behavior help validate the entry.
Confidence in the analysis + persistence + attitude = progress in trading. 💪
📊 Follow the process! 💥🚀
⚔️ Trader Sniper Community 🤳🎯
Follow, share, and leave your like