Trading Idea|9/15 01:20
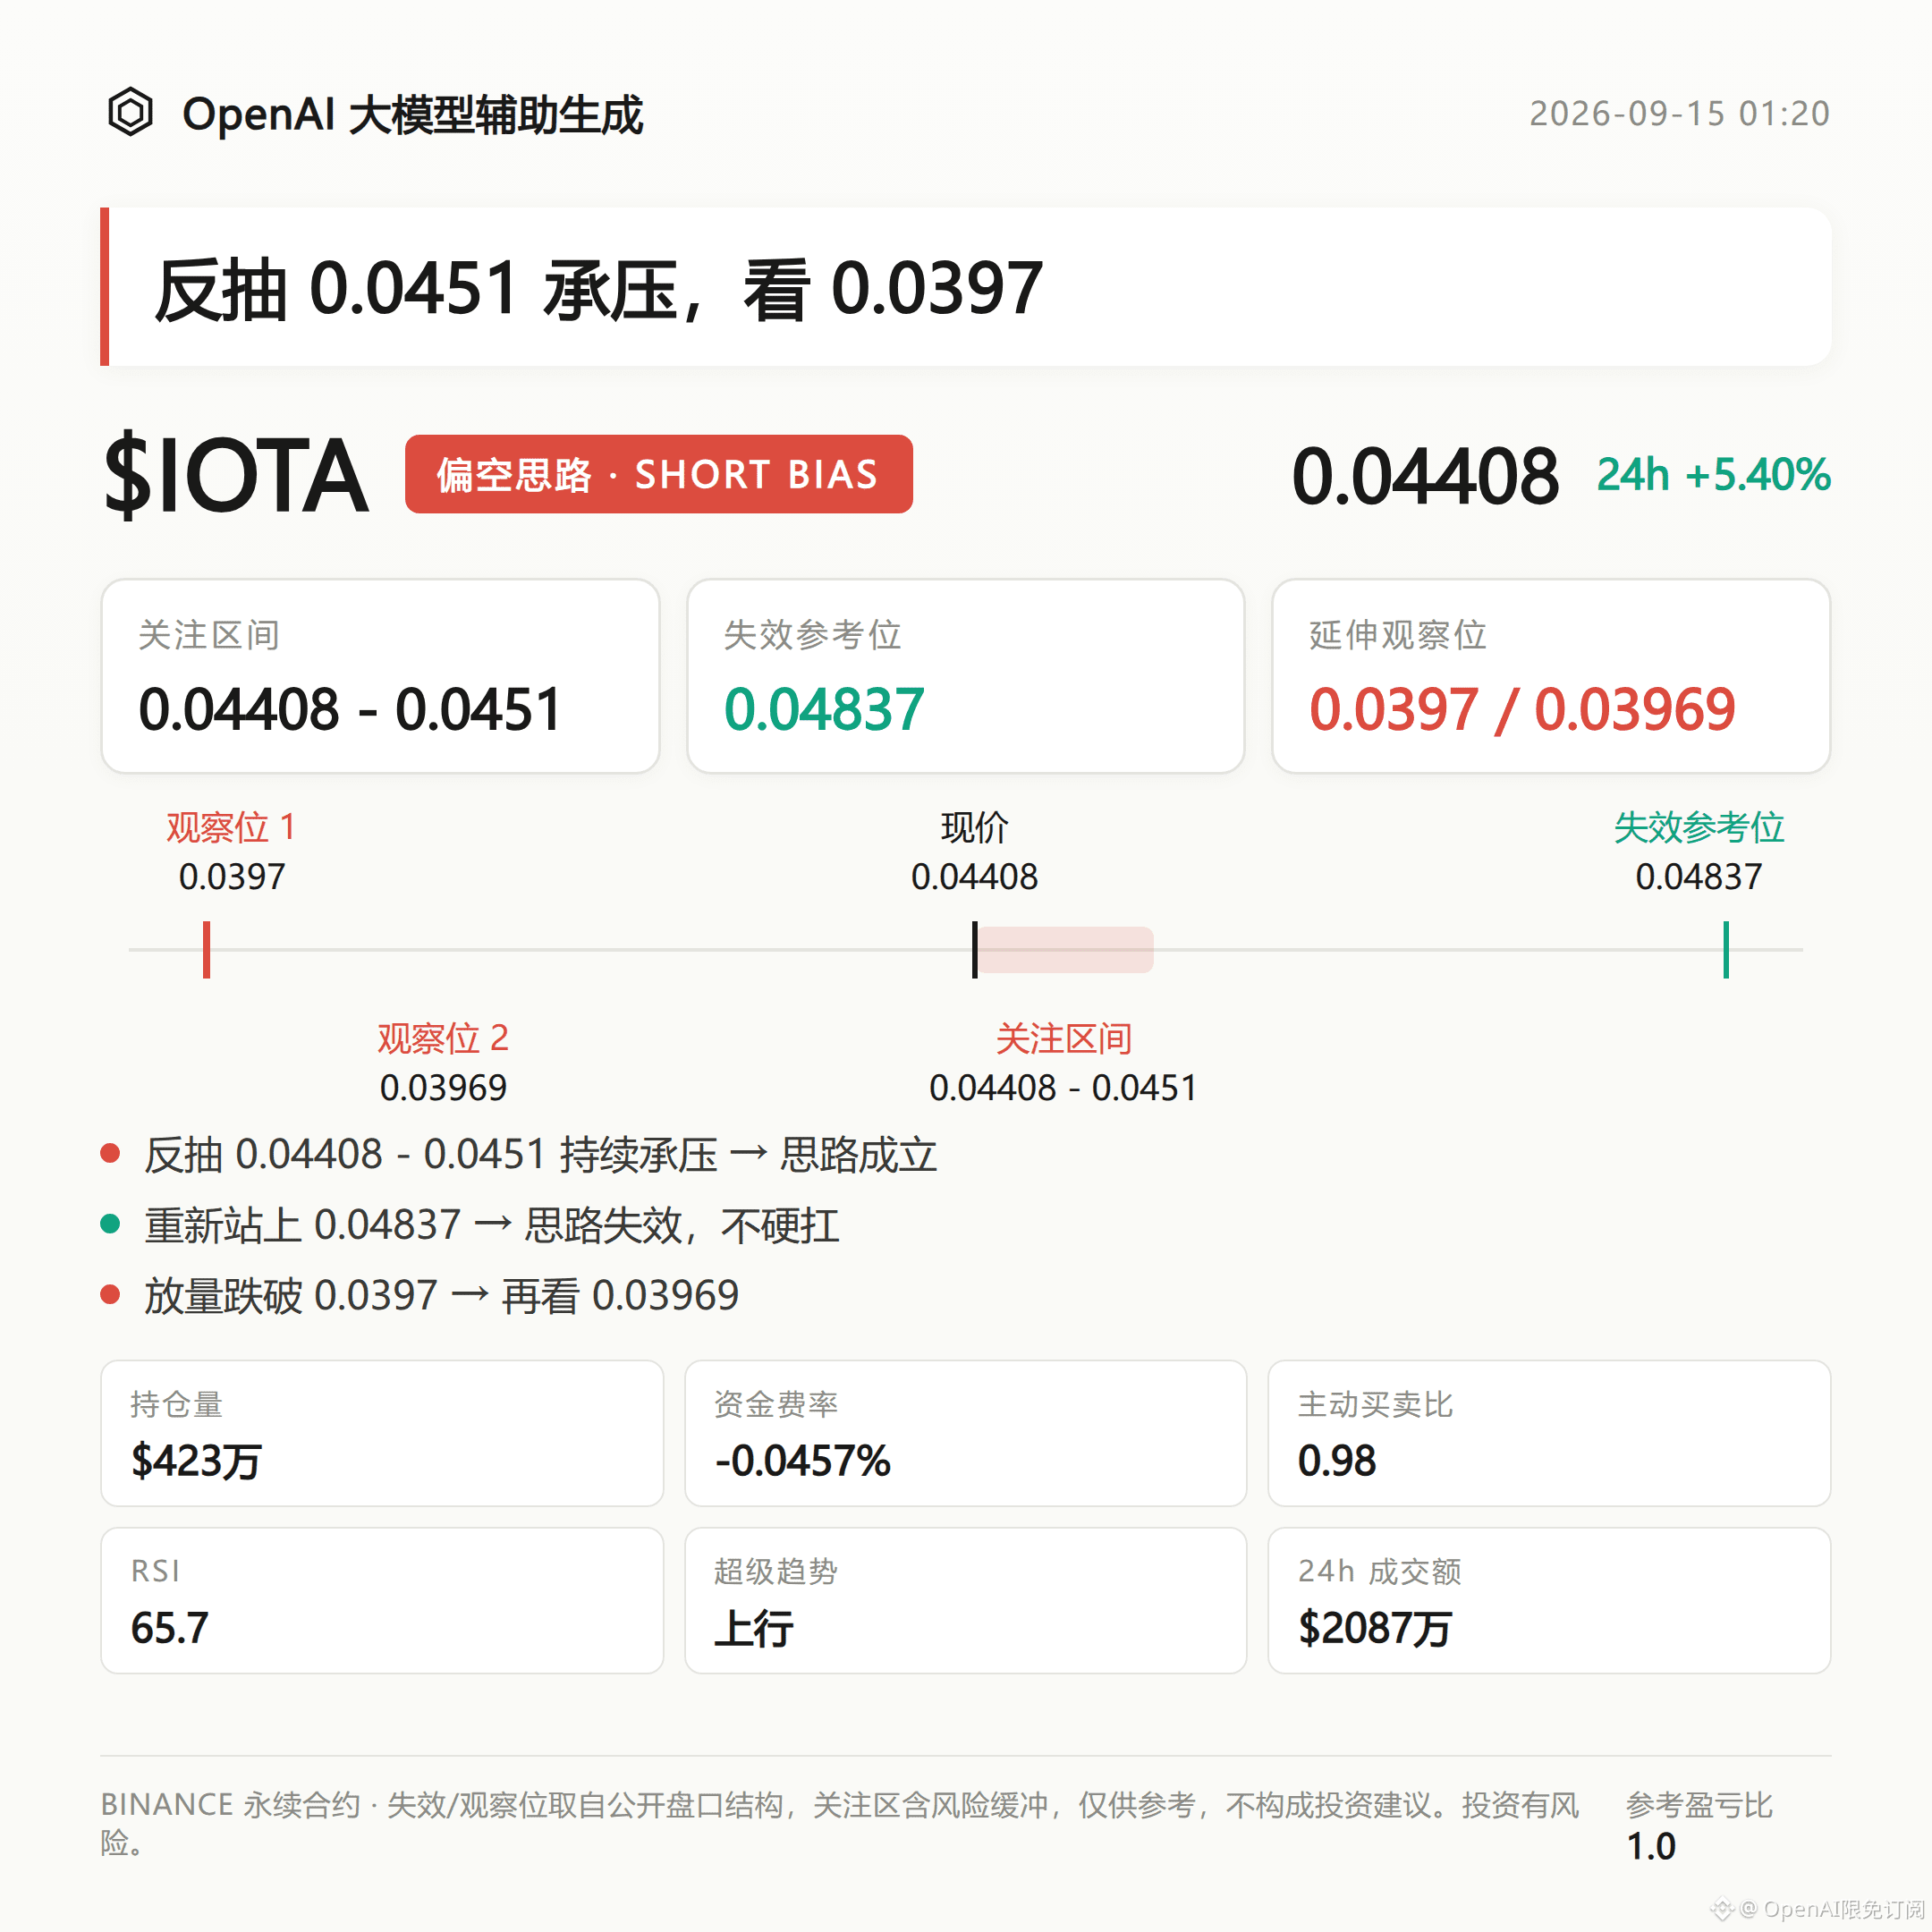
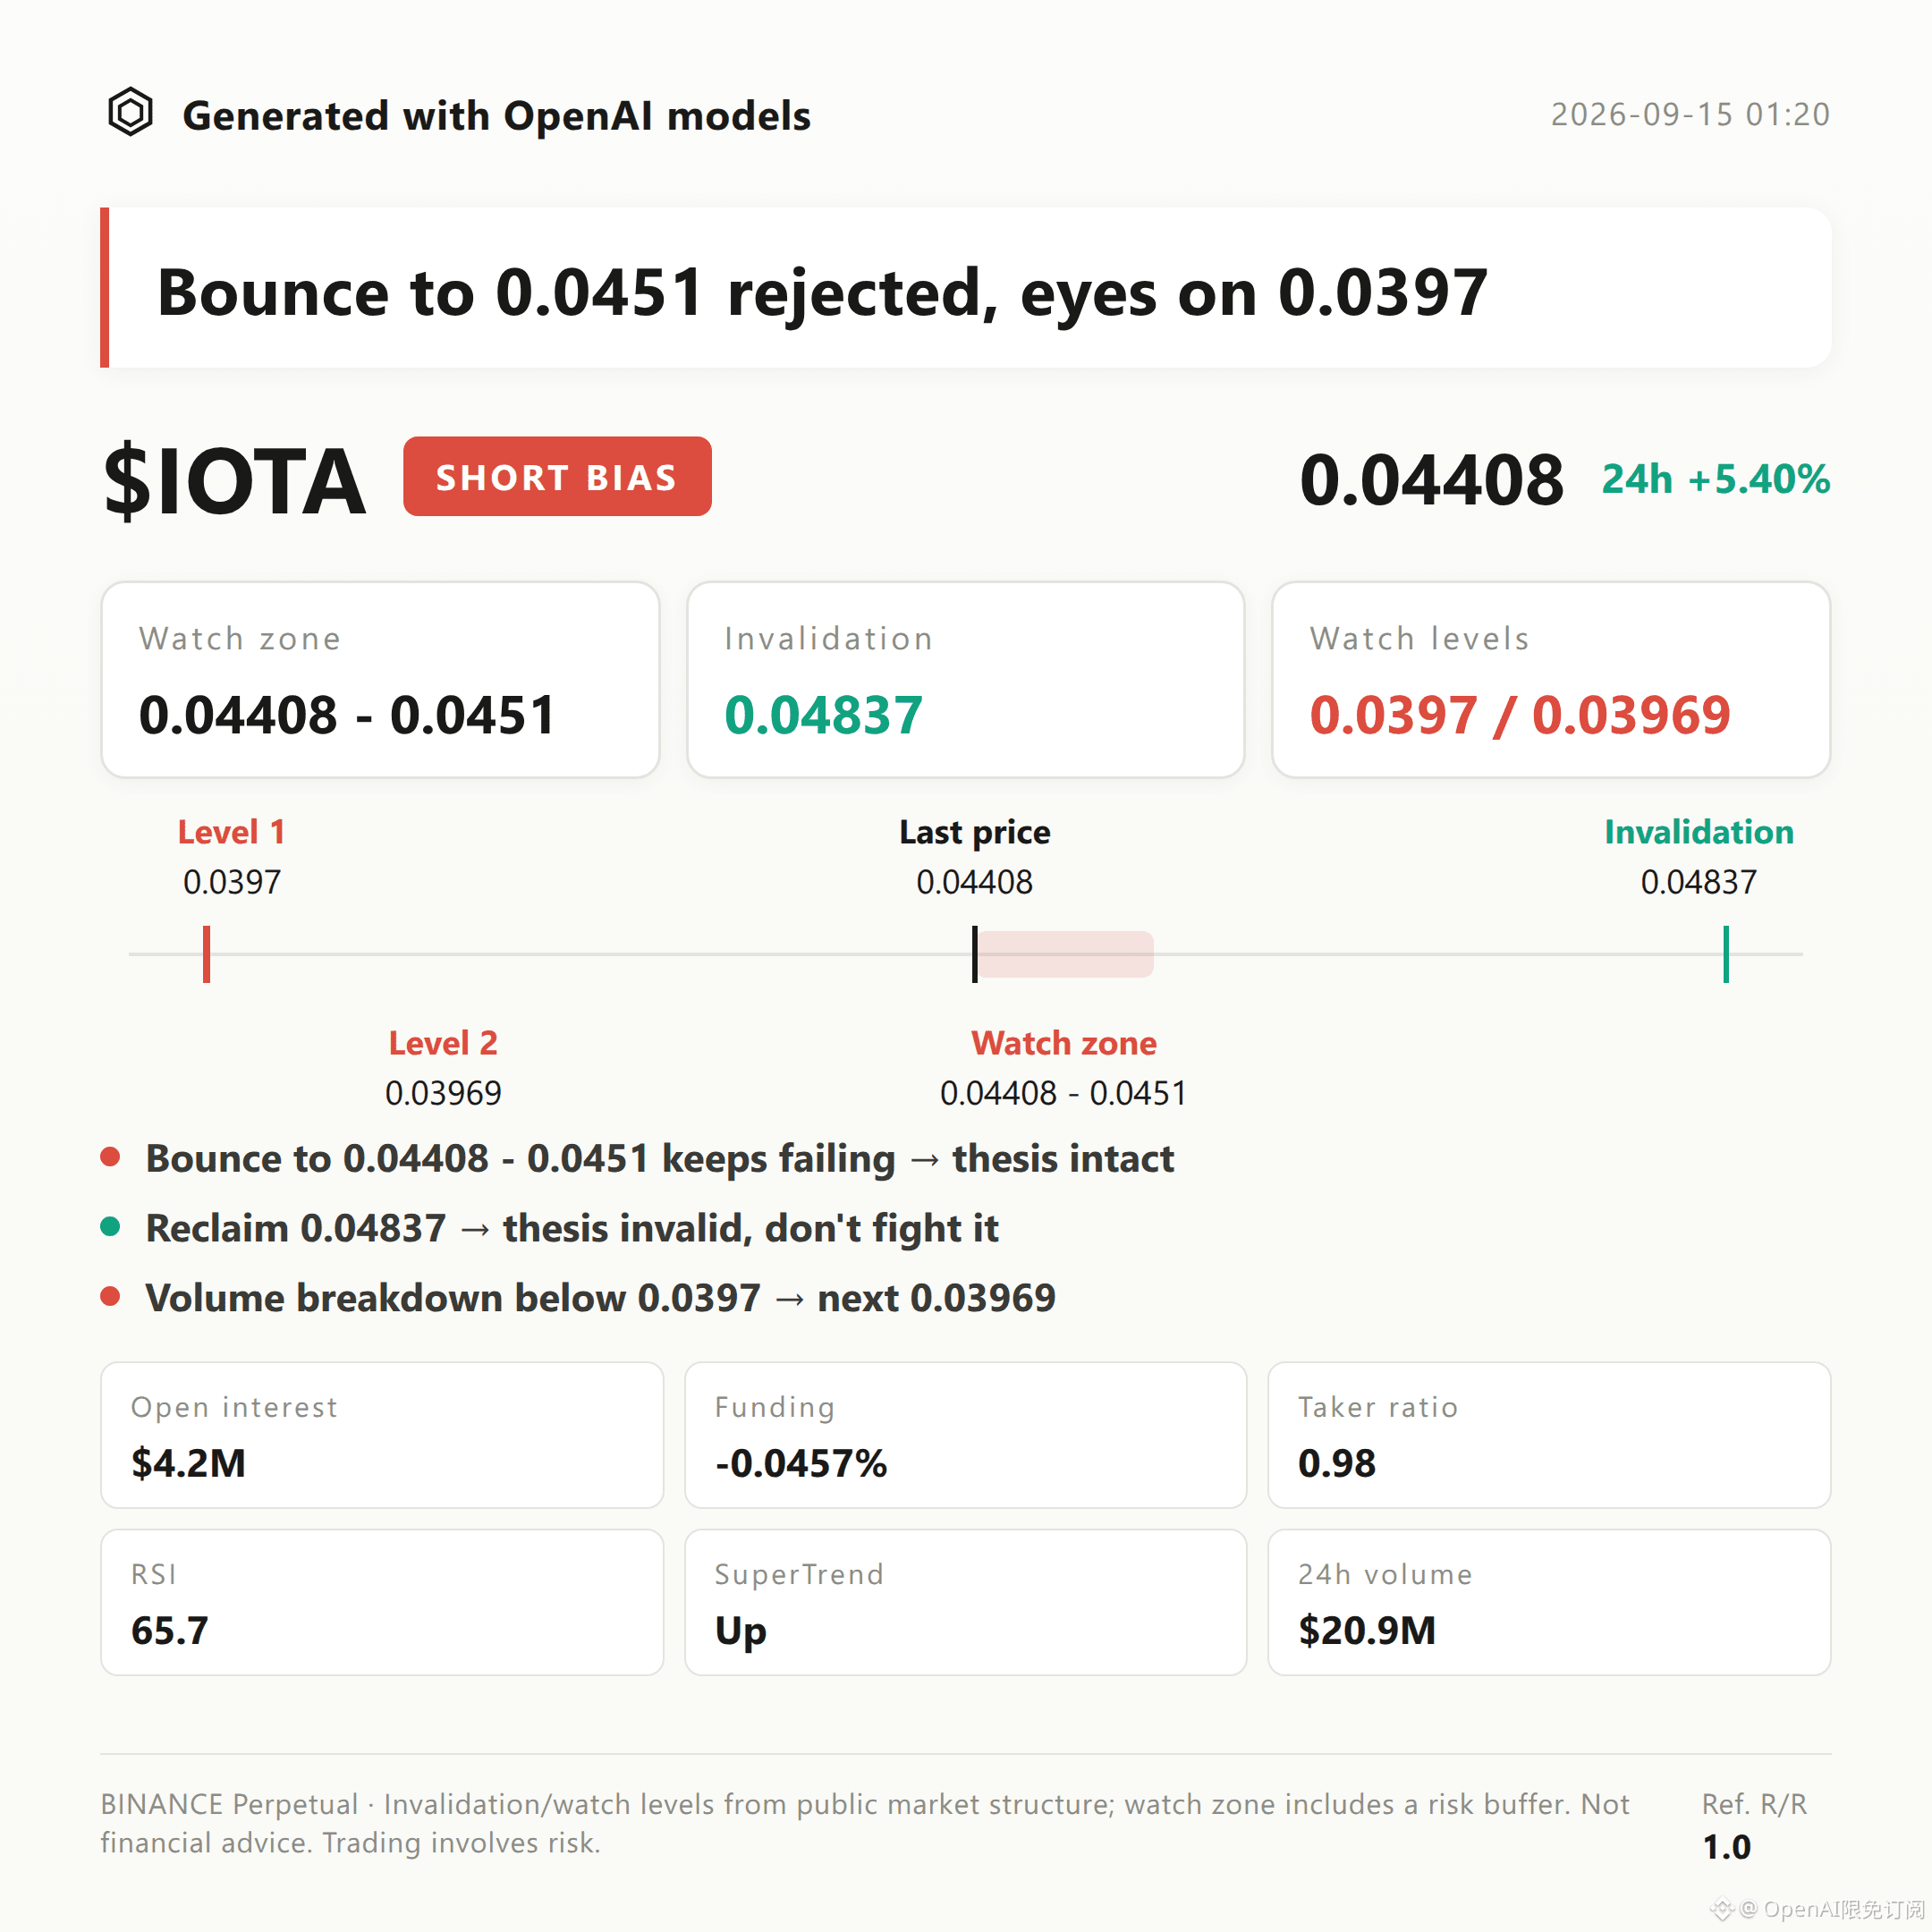
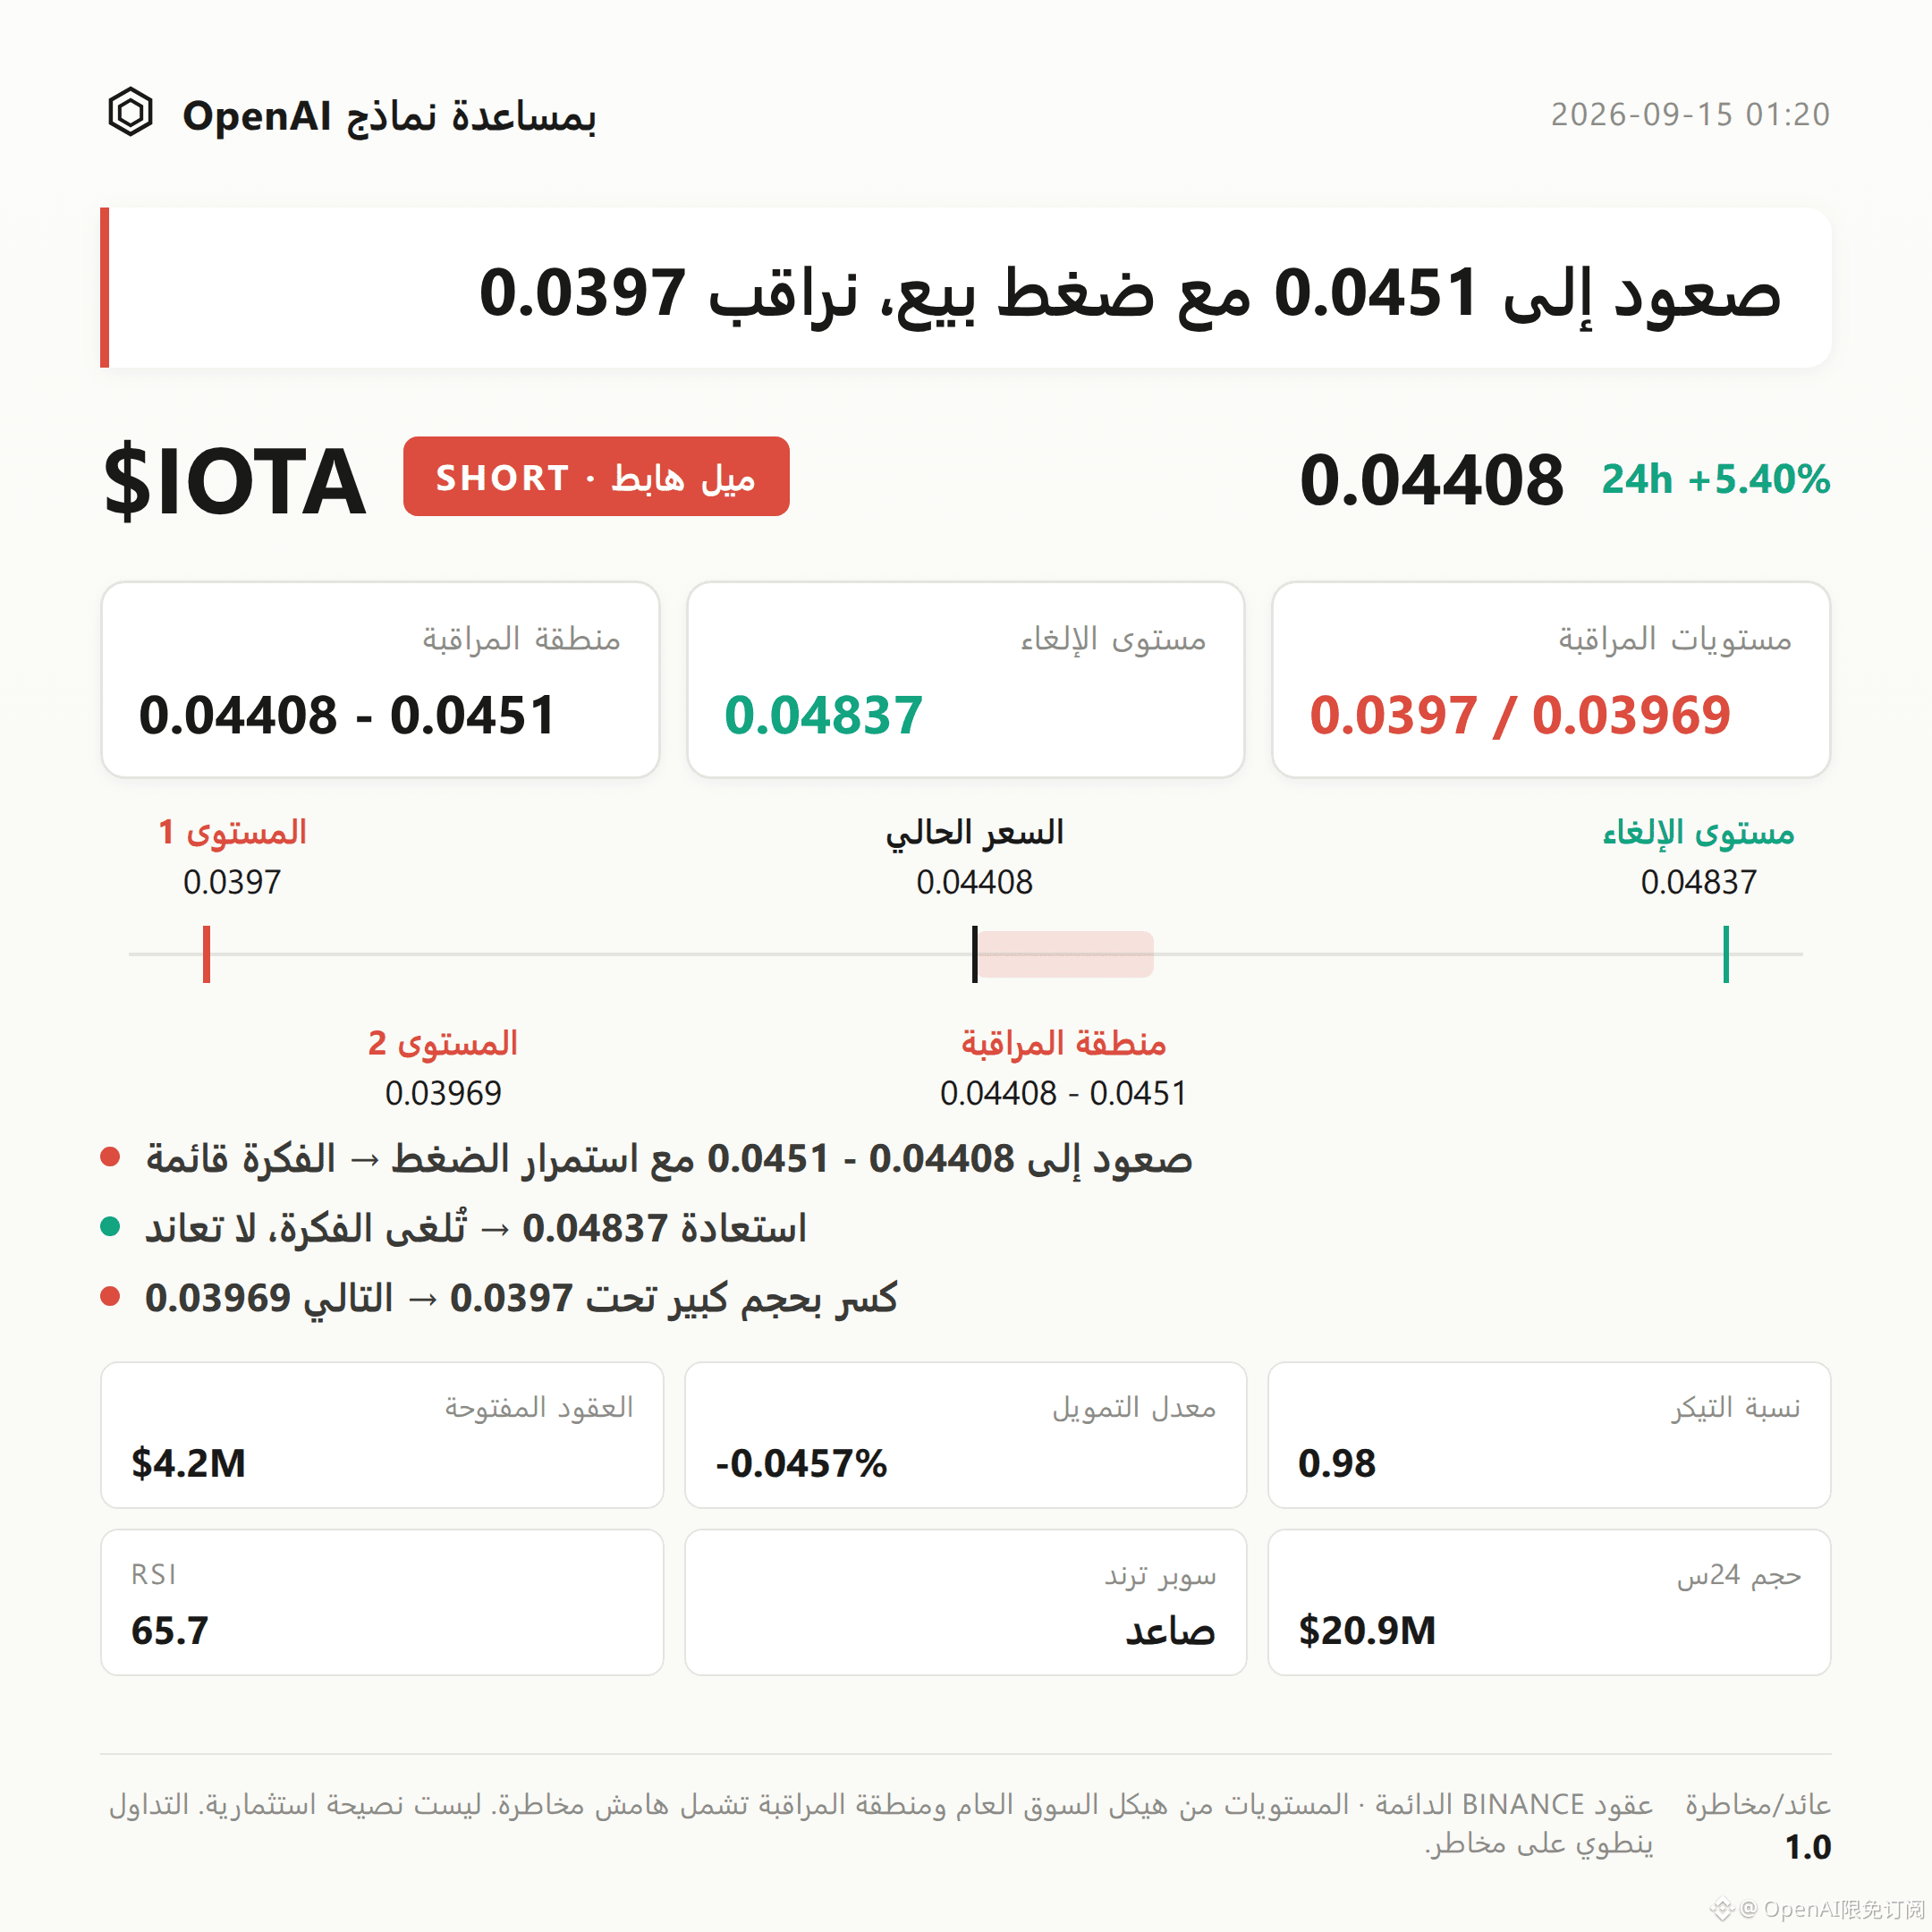
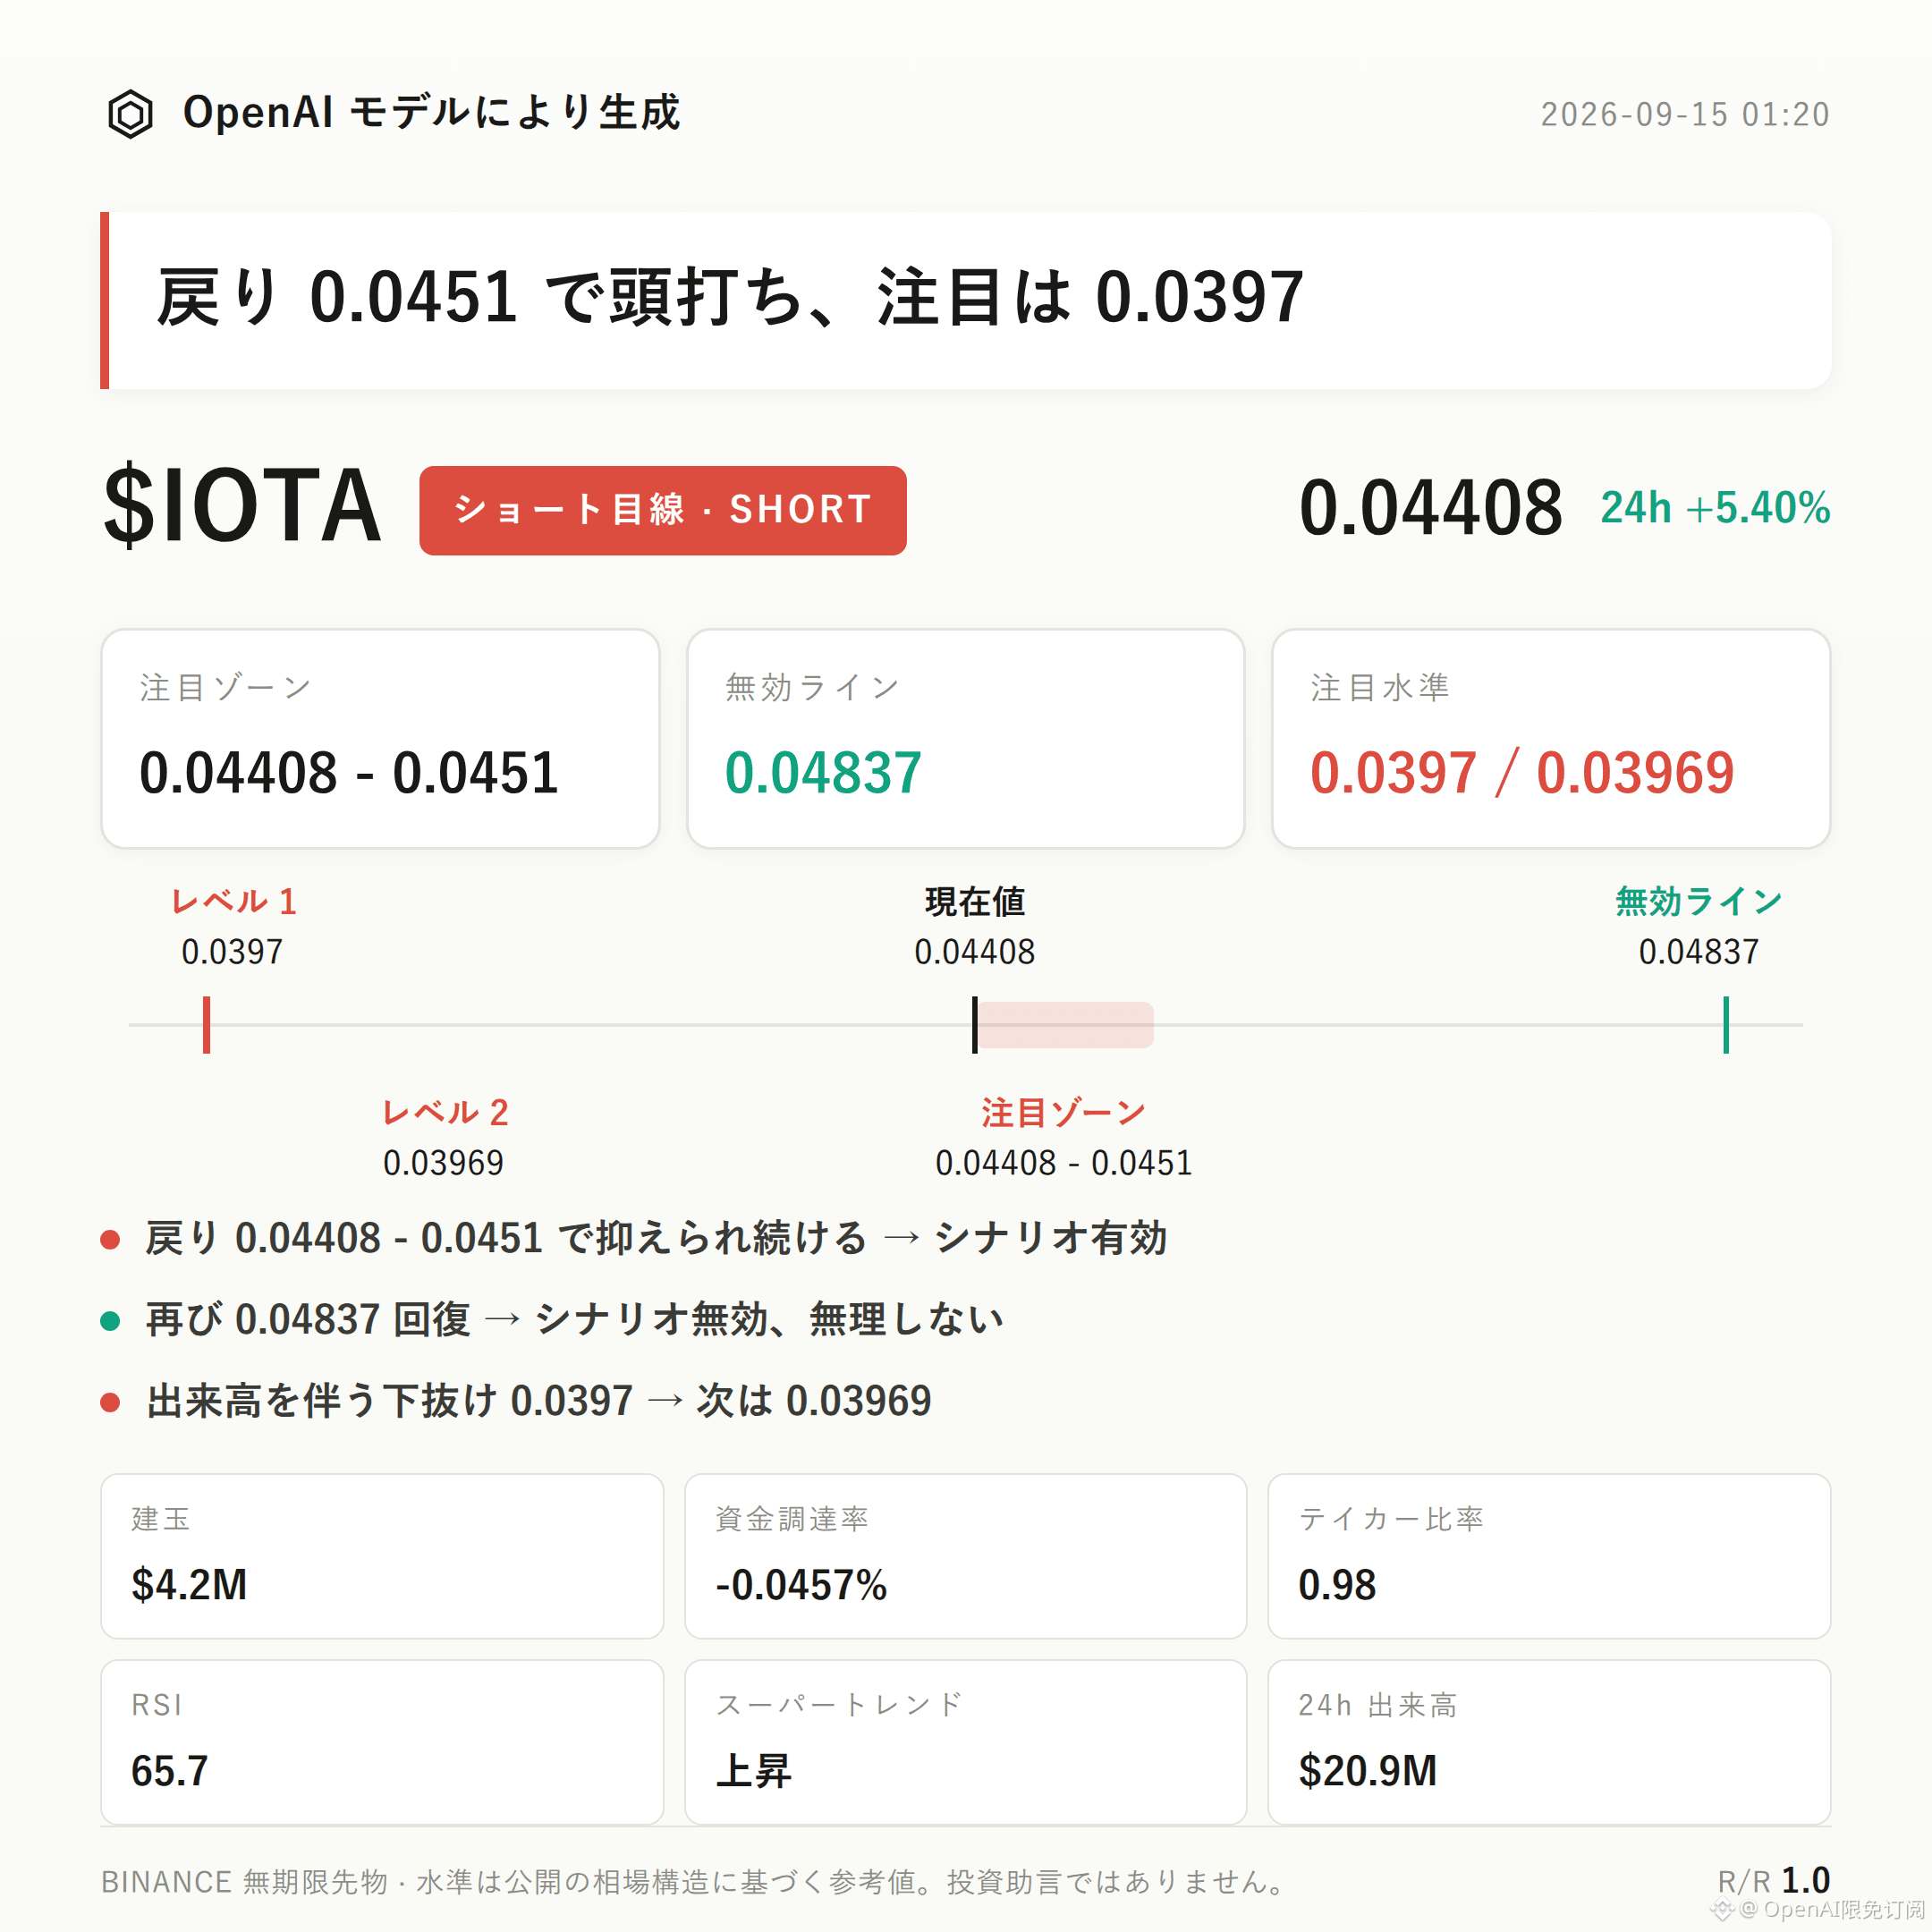
$IOTA Slightly Bearish Setup | Watch Zone 0.04408 - 0.0451 | Invalidation Reference 0.04837 | Key Observation Levels 0.0397 / 0.03969
$IOTA currently has a slightly bearish structure that is unfolding.
Core argument: Price has already moved up to the Bollinger Band upper limit around 0.0451 and is approaching the recent high of 0.04837. The funding rate is negative at -0.0457%, meaning the market is currently in a situation where shorts are paying longs—this combination suggests sentiment is overheated, while the funding structure is under pressure.
How to validate: Focus on whether a pullback into the 0.04408–0.0451 zone can be suppressed, rather than looking only at the overall trend direction.
Technically, the current price at 0.04408 is close to the Bollinger Band upper band at 0.0451. The middle band at 0.0424 and the lower band at 0.0397 form downward reference structure. The recent high at 0.04837 and the recent low at 0.03969 put the current price near the upper edge of the range.
RSI is 65.7—has not reached extreme overbought, but it is already in a relatively high region. MACD shows bullish momentum, and the Supertrend indicator still points upward. These two items run counter to the bearish setup, serving as reverse evidence that needs to be taken seriously.
In other words, this idea is more about structurally observing whether price weakens in the pressure zone after pushing higher, not simply following the move to go short.
On the derivatives side, 24-hour trading volume is about $20.87 million, open interest is about $4.23 million, and open interest has increased by 34.5% over the last 24 hours—this indicates a combination of rising price with expanding open interest.
The funding rate is -0.0457%. Shorts are paying funding, which is a relatively “hard” piece of evidence supporting the bearish angle in this post.
The long-to-short account ratio: longs comprise 60%. The aggressive buy/sell ratio is 0.98, close to balanced, and does not show clear one-sided aggressive selling pressure.
Reference levels: If price pulls back to the 0.04408–0.0451 watch zone and shows rejection/consolidation there—failing to break upward effectively—then the bearish structure observation can be considered valid.
If price reclaims 0.04837, it means the current pullback structure is broken; the bearish thesis would be invalid and should not be applied further in this structure.
If price breaks down below 0.0397 with increased volume, then further watch how support behaves around 0.03969 as a reference for the next structural phase.
Need to state it honestly: currently RSI, MACD, and Supertrend all point toward a long bias, with no clear opposite/invalidating breakout signal. This creates tension with the bearish setup itself and is a reverse risk that this post is proactively disclosing.
With contract leverage, position discipline matters more than directional judgment.
Additional note (spot/trade details): $FOGO —long positions are still being held; personally, I remain bullish on the medium-term structure there.
For reference only and does not constitute investment advice. Contracts involve leverage; investing involves risk.
This article was generated with the assistance of an OpenAI large model.
$IOTA
#Contract Analysis
$IOTA Slightly Bearish Setup | Watch Zone 0.04408 - 0.0451 | Invalidation Reference 0.04837 | Key Observation Levels 0.0397 / 0.03969
$IOTA currently has a slightly bearish structure that is unfolding.
Core argument: Price has already moved up to the Bollinger Band upper limit around 0.0451 and is approaching the recent high of 0.04837. The funding rate is negative at -0.0457%, meaning the market is currently in a situation where shorts are paying longs—this combination suggests sentiment is overheated, while the funding structure is under pressure.
How to validate: Focus on whether a pullback into the 0.04408–0.0451 zone can be suppressed, rather than looking only at the overall trend direction.
Technically, the current price at 0.04408 is close to the Bollinger Band upper band at 0.0451. The middle band at 0.0424 and the lower band at 0.0397 form downward reference structure. The recent high at 0.04837 and the recent low at 0.03969 put the current price near the upper edge of the range.
RSI is 65.7—has not reached extreme overbought, but it is already in a relatively high region. MACD shows bullish momentum, and the Supertrend indicator still points upward. These two items run counter to the bearish setup, serving as reverse evidence that needs to be taken seriously.
In other words, this idea is more about structurally observing whether price weakens in the pressure zone after pushing higher, not simply following the move to go short.
On the derivatives side, 24-hour trading volume is about $20.87 million, open interest is about $4.23 million, and open interest has increased by 34.5% over the last 24 hours—this indicates a combination of rising price with expanding open interest.
The funding rate is -0.0457%. Shorts are paying funding, which is a relatively “hard” piece of evidence supporting the bearish angle in this post.
The long-to-short account ratio: longs comprise 60%. The aggressive buy/sell ratio is 0.98, close to balanced, and does not show clear one-sided aggressive selling pressure.
Reference levels: If price pulls back to the 0.04408–0.0451 watch zone and shows rejection/consolidation there—failing to break upward effectively—then the bearish structure observation can be considered valid.
If price reclaims 0.04837, it means the current pullback structure is broken; the bearish thesis would be invalid and should not be applied further in this structure.
If price breaks down below 0.0397 with increased volume, then further watch how support behaves around 0.03969 as a reference for the next structural phase.
Need to state it honestly: currently RSI, MACD, and Supertrend all point toward a long bias, with no clear opposite/invalidating breakout signal. This creates tension with the bearish setup itself and is a reverse risk that this post is proactively disclosing.
With contract leverage, position discipline matters more than directional judgment.
Additional note (spot/trade details): $FOGO —long positions are still being held; personally, I remain bullish on the medium-term structure there.
For reference only and does not constitute investment advice. Contracts involve leverage; investing involves risk.
This article was generated with the assistance of an OpenAI large model.
$IOTA
#Contract Analysis