Trading Ideas | 9/14 23:20
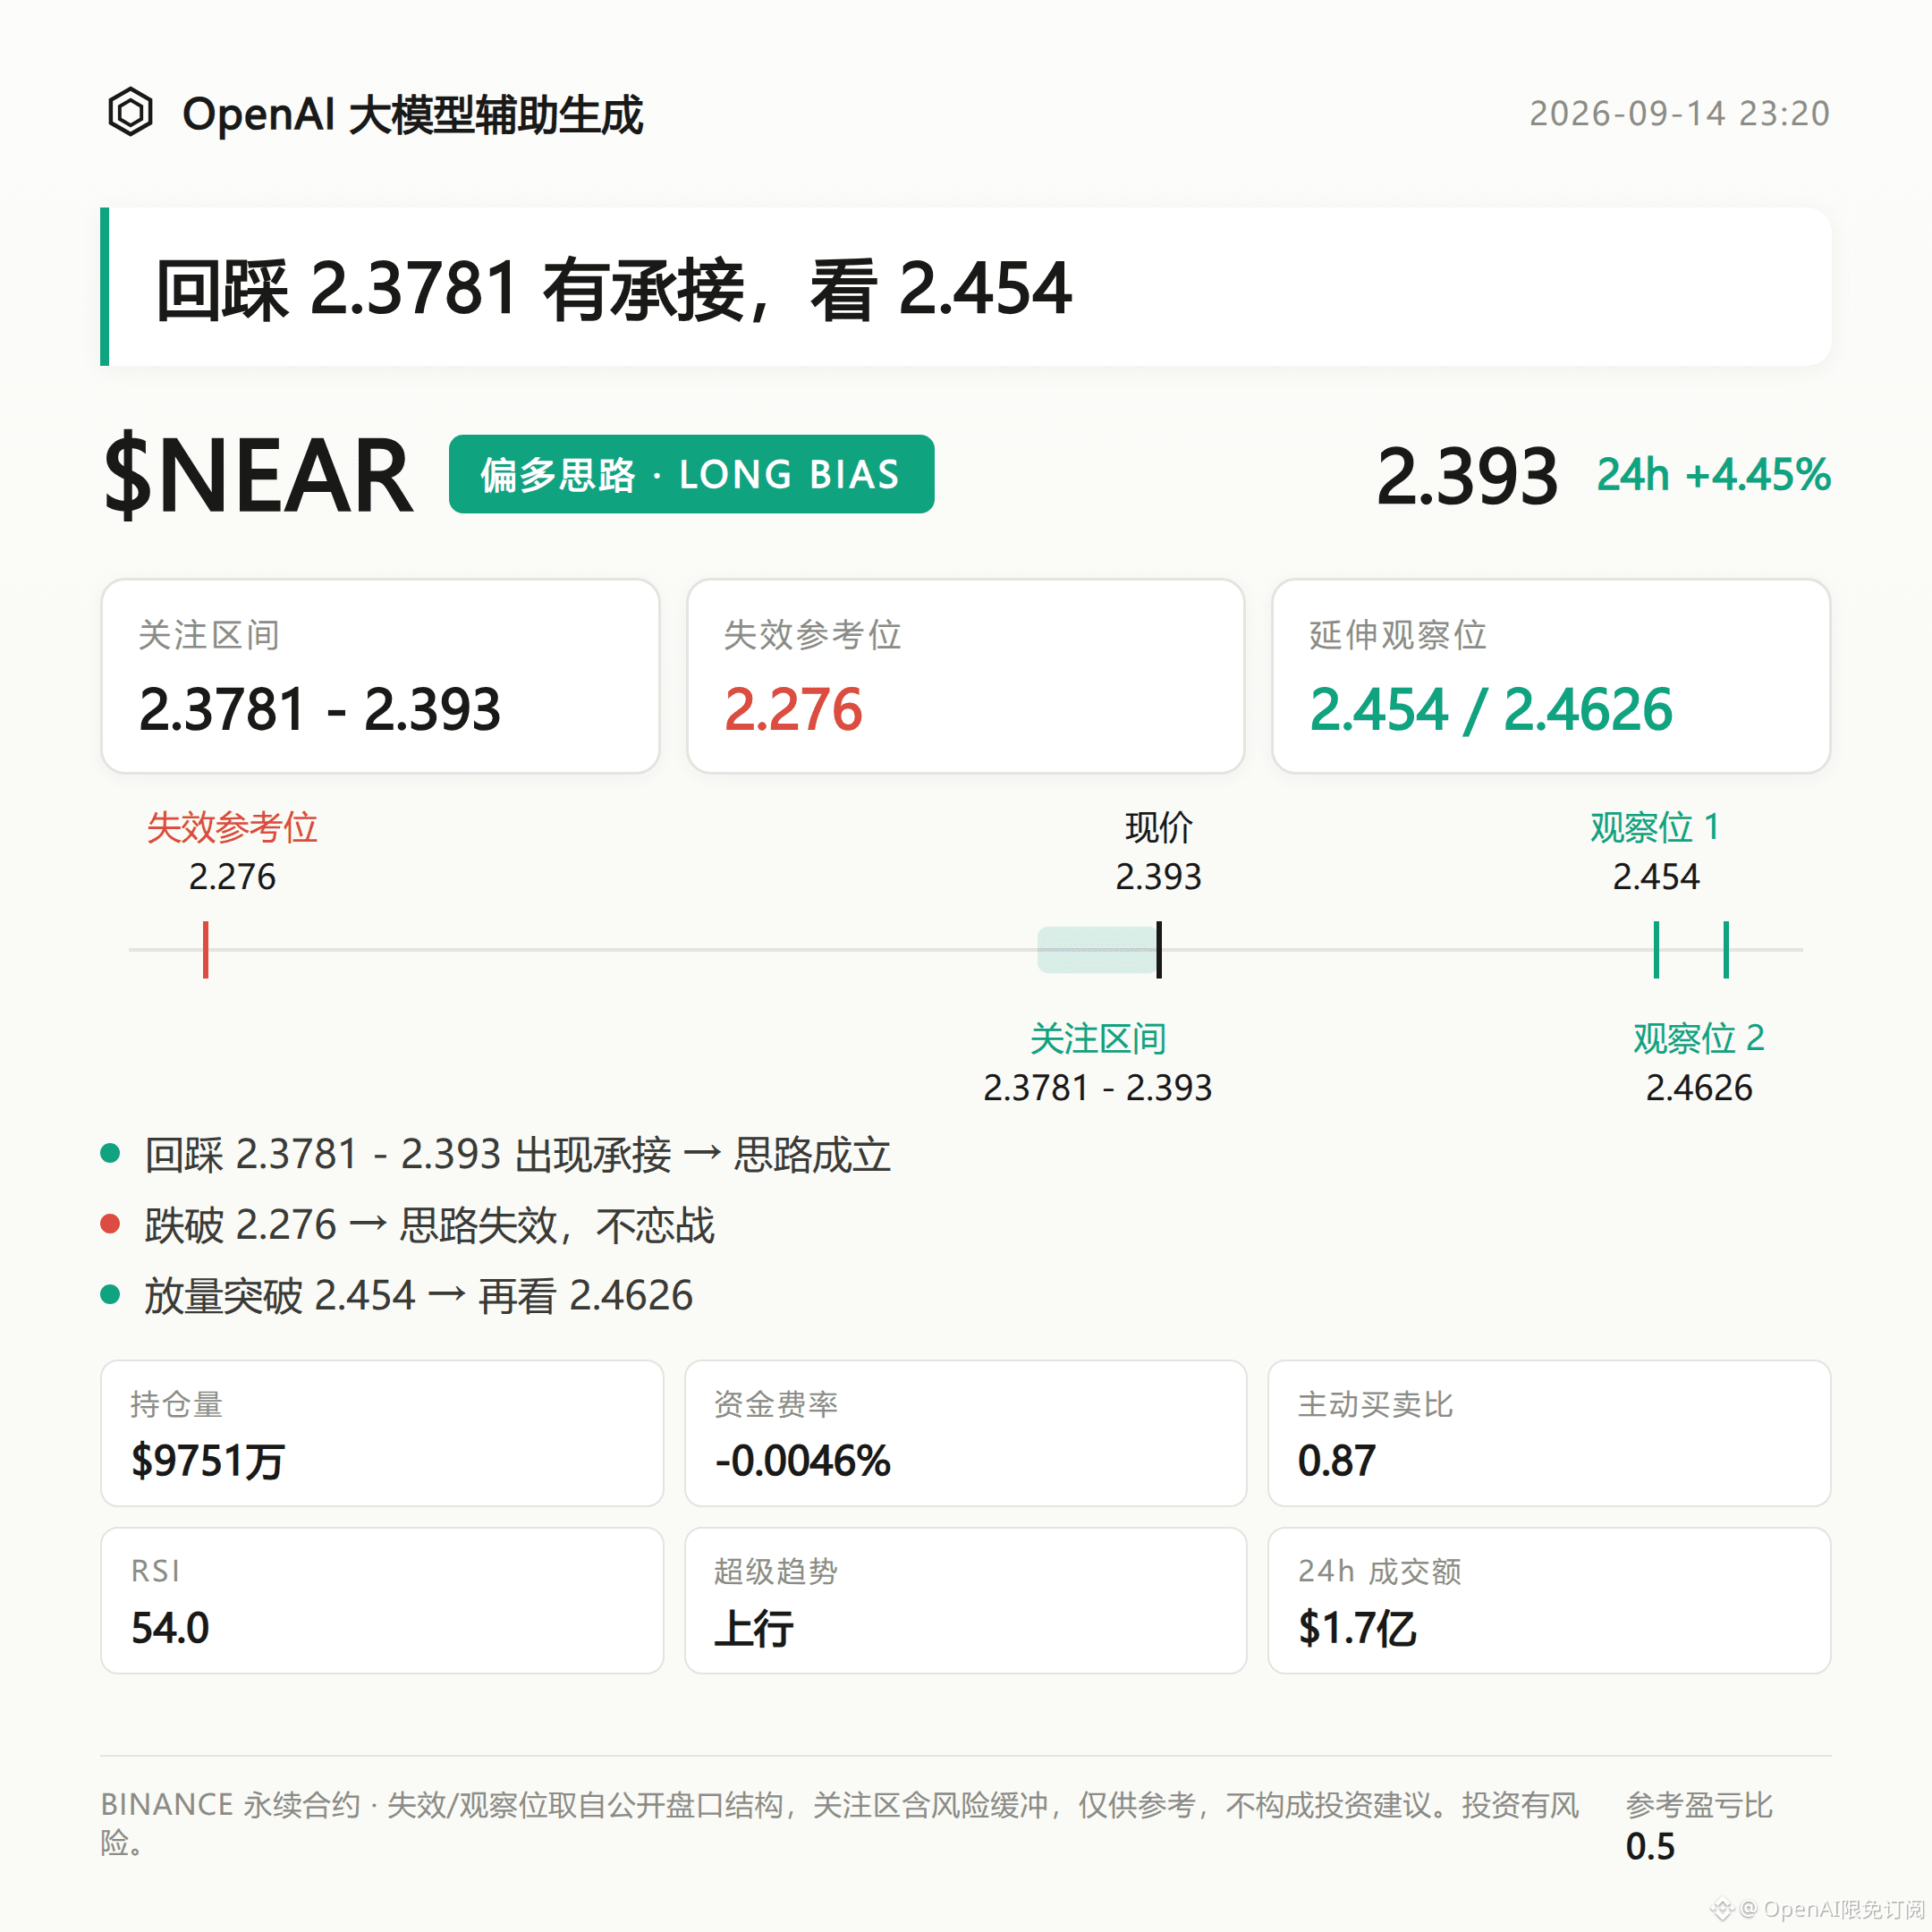
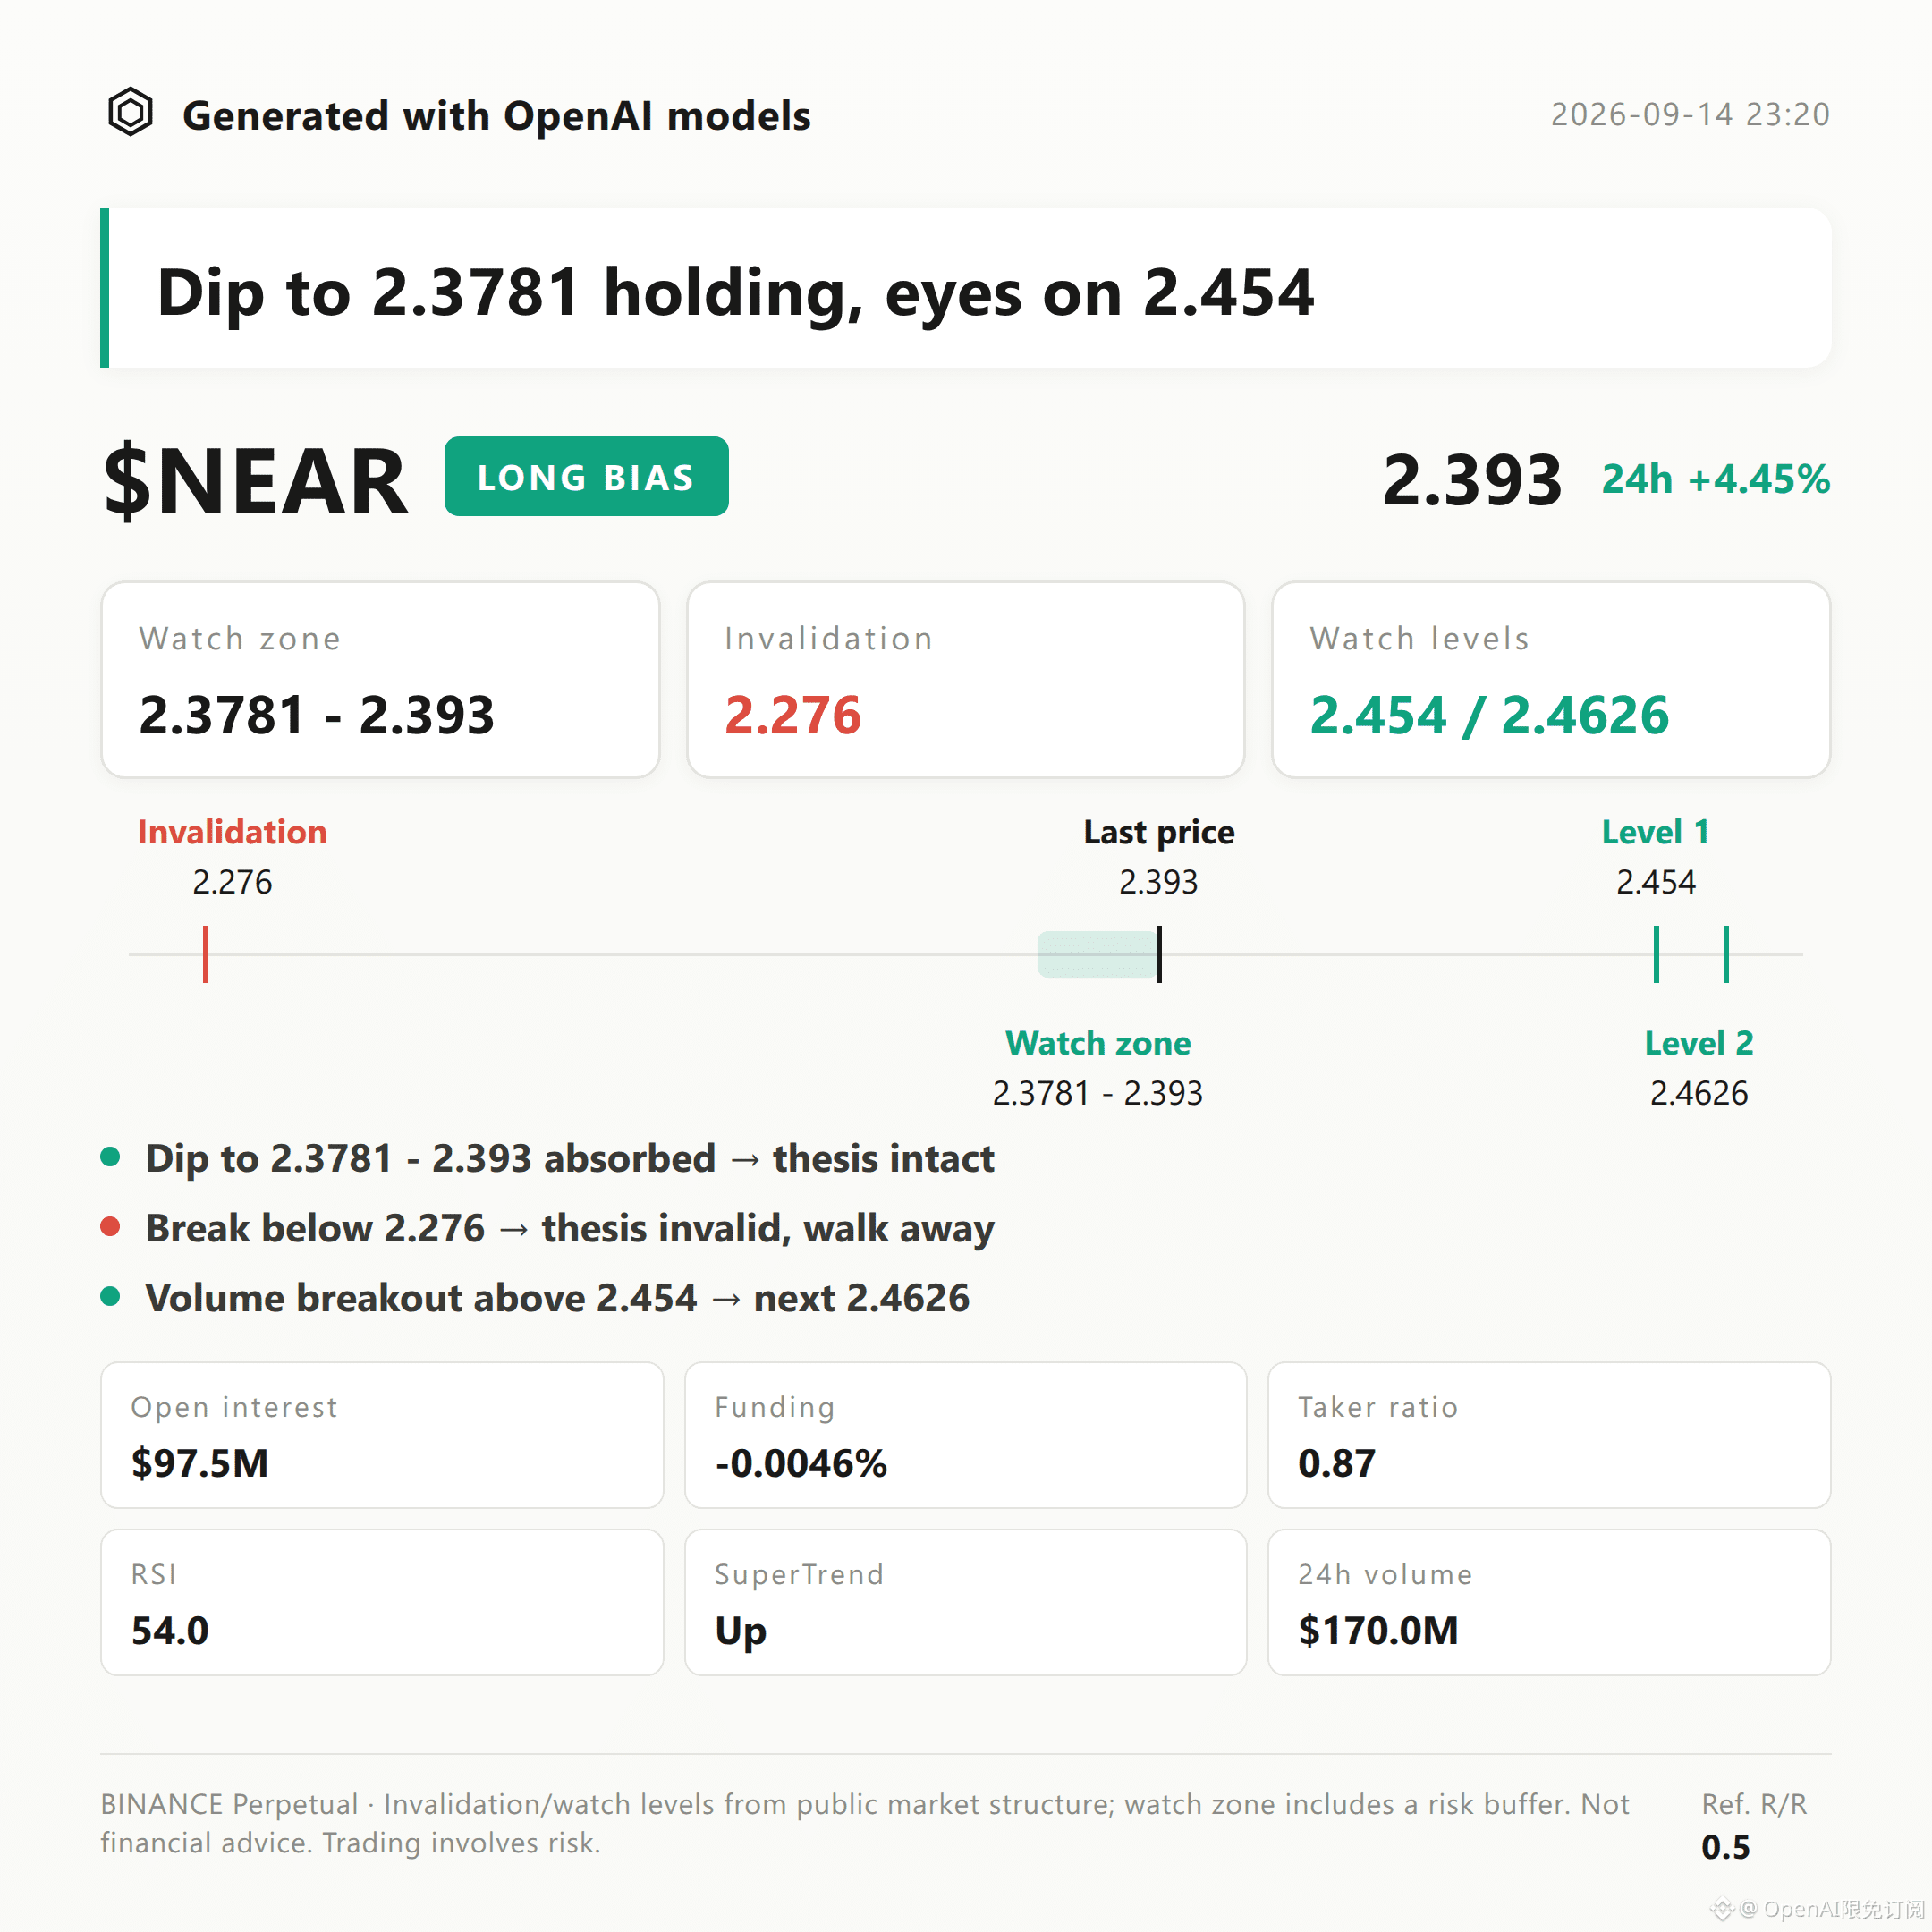
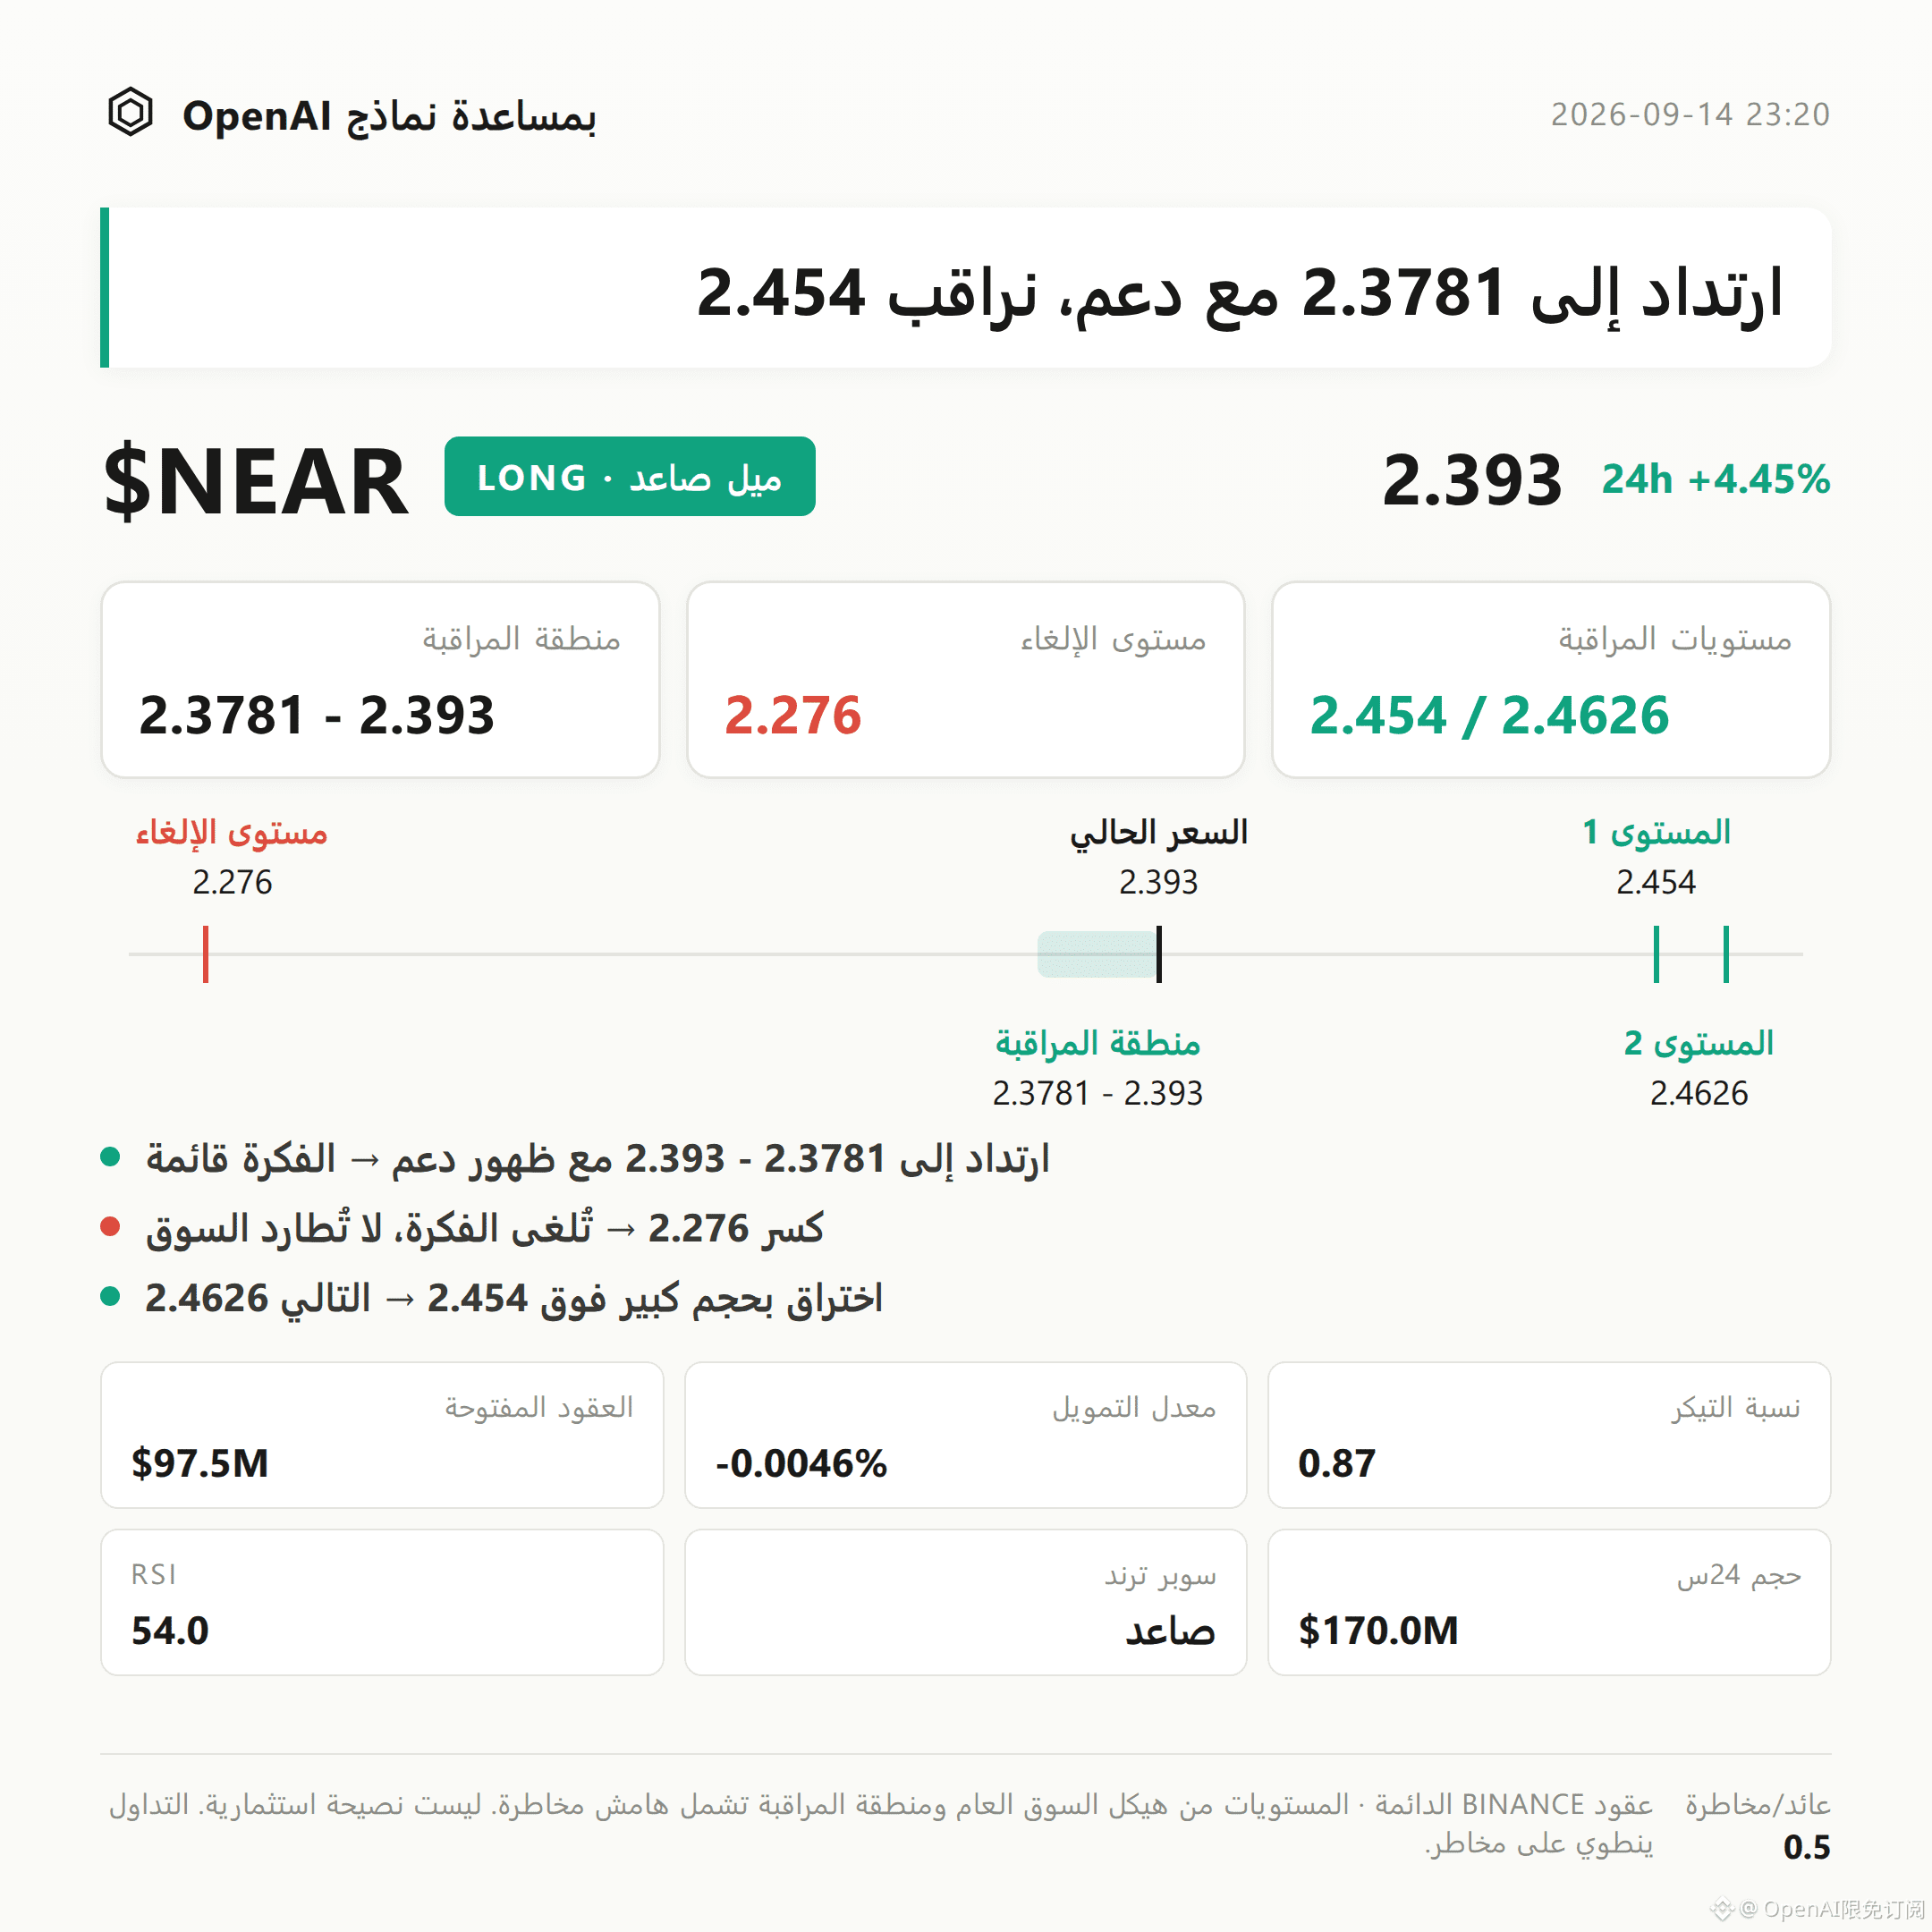
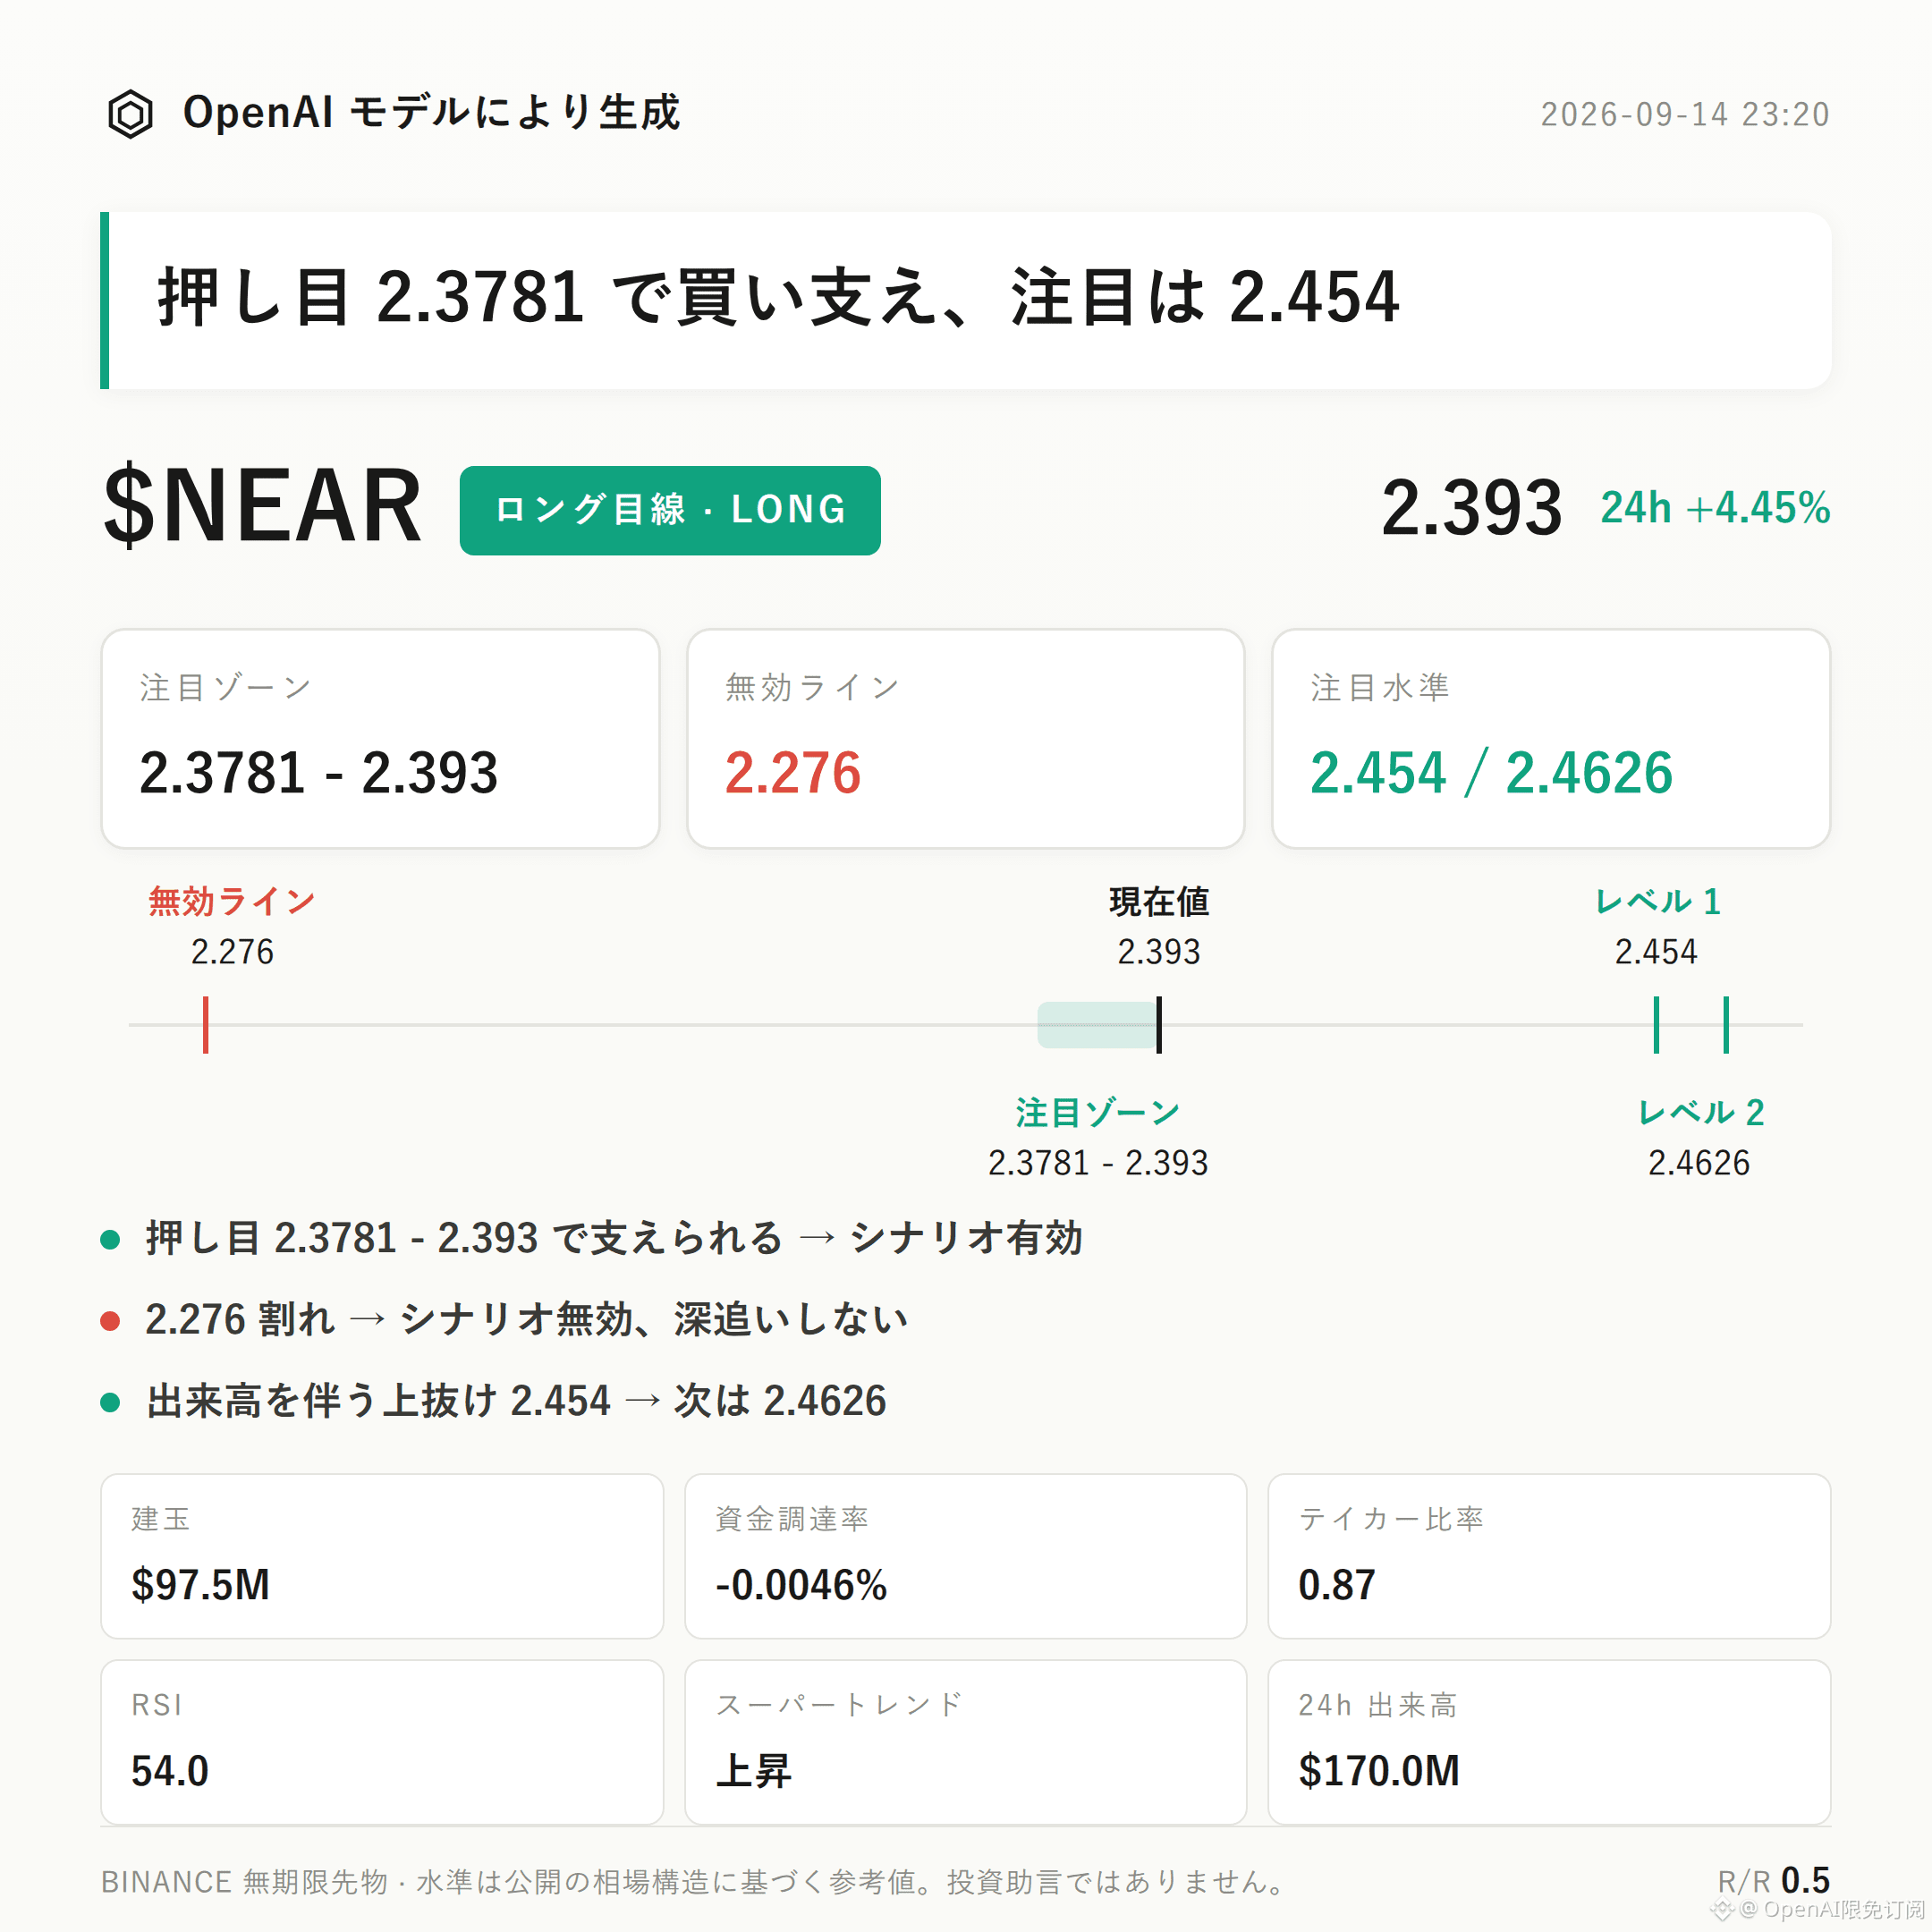
$NEAR Bullish Bias | Focus Zone 2.3781 - 2.393 | Invalidation Reference 2.276 | Observation Levels 2.454 / 2.4626
$NEAR ’s bullish outlook holds true.
The core thesis is that the Supertrend remains upward, the MACD shows bullish momentum, and open interest increased by 3.9% over the past 24 hours—together indicating that bullish funds are still following through.
The validation focuses on whether the bullish focus zone can continue to provide support/acceptance, and whether volume expansion at the observation levels suggests the structure is continuing.
From a technical structure perspective: the current price of $NEAR is 2.393, positioned slightly above the recent low of 2.276 and below the recent high of 2.454.
The Bollinger middle band is at 2.3781; the current price is running just above the middle band. The upper band is 2.4626 and the lower band is 2.2936, with the channel overall opening upward.
The Supertrend indicator shows an uptrend; the MACD maintains bullish momentum. RSI is 54.0, sitting in a healthy range without any clear overbought signal.
The 24-hour increase is 4.45%, which reflects trend-following continuation.
On the derivatives side, there is also resonance, but there are discrepancies worth noting.
24-hour trading volume is 170 million (1.7e8), open interest is 97.51 million, up 3.9% over the past 24 hours—indicating that new positions are entering in the same direction as the price rise.
Funding rate is -0.0046%; the long account share is 61%, and the long/short structure is tilted toward the long side.
However, the aggressive buy/sell ratio is 0.87, meaning the strength of aggressive sell orders has not fallen behind buys; buys are not clearly dominant. This partially diverges from the price increase—an important contrarian signal that this post needs to actively flag.
Turn the reference levels into a decision tree.
If the price pulls back to the bullish focus zone 2.3781 - 2.393 and shows signs of support, the bullish idea can remain valid—better to wait for confirmation rather than chase.
If the price breaks below the invalidation reference 2.276, it means the current breakout/upthrust structure has been damaged, and the bullish idea is invalidated accordingly—no reason to keep fighting.
If price breaks upward with volume beyond the observation level 2.454, you can then watch performance near the overhead resistance around 2.4626; whether it can hold will determine the subsequent upside space.
The risks that must be disclosed honestly: the aggressive buy/sell ratio of 0.87 shows that buys are not dominant. The current rise depends more on passive following rather than active, aggressive buying. If support is insufficient, the price may repeatedly test below the focus zone.
The reference risk/reward ratio is 0.5, which is relatively low—suggesting that potential upside within this structure is limited, and it does not justify continuing to hold or increasing exposure.
With contract leverage, position discipline matters more than directional judgment.
Also attached spot/real positions: $FOGO —long positions are still being held; personally, I remain bullish on the medium-term structure.
For reference only and not investment advice. Contracts involve leverage, and investing is risky.
This article was generated with the help of an OpenAI large model.
$NEAR
#Contract Analysis
$NEAR Bullish Bias | Focus Zone 2.3781 - 2.393 | Invalidation Reference 2.276 | Observation Levels 2.454 / 2.4626
$NEAR ’s bullish outlook holds true.
The core thesis is that the Supertrend remains upward, the MACD shows bullish momentum, and open interest increased by 3.9% over the past 24 hours—together indicating that bullish funds are still following through.
The validation focuses on whether the bullish focus zone can continue to provide support/acceptance, and whether volume expansion at the observation levels suggests the structure is continuing.
From a technical structure perspective: the current price of $NEAR is 2.393, positioned slightly above the recent low of 2.276 and below the recent high of 2.454.
The Bollinger middle band is at 2.3781; the current price is running just above the middle band. The upper band is 2.4626 and the lower band is 2.2936, with the channel overall opening upward.
The Supertrend indicator shows an uptrend; the MACD maintains bullish momentum. RSI is 54.0, sitting in a healthy range without any clear overbought signal.
The 24-hour increase is 4.45%, which reflects trend-following continuation.
On the derivatives side, there is also resonance, but there are discrepancies worth noting.
24-hour trading volume is 170 million (1.7e8), open interest is 97.51 million, up 3.9% over the past 24 hours—indicating that new positions are entering in the same direction as the price rise.
Funding rate is -0.0046%; the long account share is 61%, and the long/short structure is tilted toward the long side.
However, the aggressive buy/sell ratio is 0.87, meaning the strength of aggressive sell orders has not fallen behind buys; buys are not clearly dominant. This partially diverges from the price increase—an important contrarian signal that this post needs to actively flag.
Turn the reference levels into a decision tree.
If the price pulls back to the bullish focus zone 2.3781 - 2.393 and shows signs of support, the bullish idea can remain valid—better to wait for confirmation rather than chase.
If the price breaks below the invalidation reference 2.276, it means the current breakout/upthrust structure has been damaged, and the bullish idea is invalidated accordingly—no reason to keep fighting.
If price breaks upward with volume beyond the observation level 2.454, you can then watch performance near the overhead resistance around 2.4626; whether it can hold will determine the subsequent upside space.
The risks that must be disclosed honestly: the aggressive buy/sell ratio of 0.87 shows that buys are not dominant. The current rise depends more on passive following rather than active, aggressive buying. If support is insufficient, the price may repeatedly test below the focus zone.
The reference risk/reward ratio is 0.5, which is relatively low—suggesting that potential upside within this structure is limited, and it does not justify continuing to hold or increasing exposure.
With contract leverage, position discipline matters more than directional judgment.
Also attached spot/real positions: $FOGO —long positions are still being held; personally, I remain bullish on the medium-term structure.
For reference only and not investment advice. Contracts involve leverage, and investing is risky.
This article was generated with the help of an OpenAI large model.
$NEAR
#Contract Analysis