Trading Setup|9/14 22:21
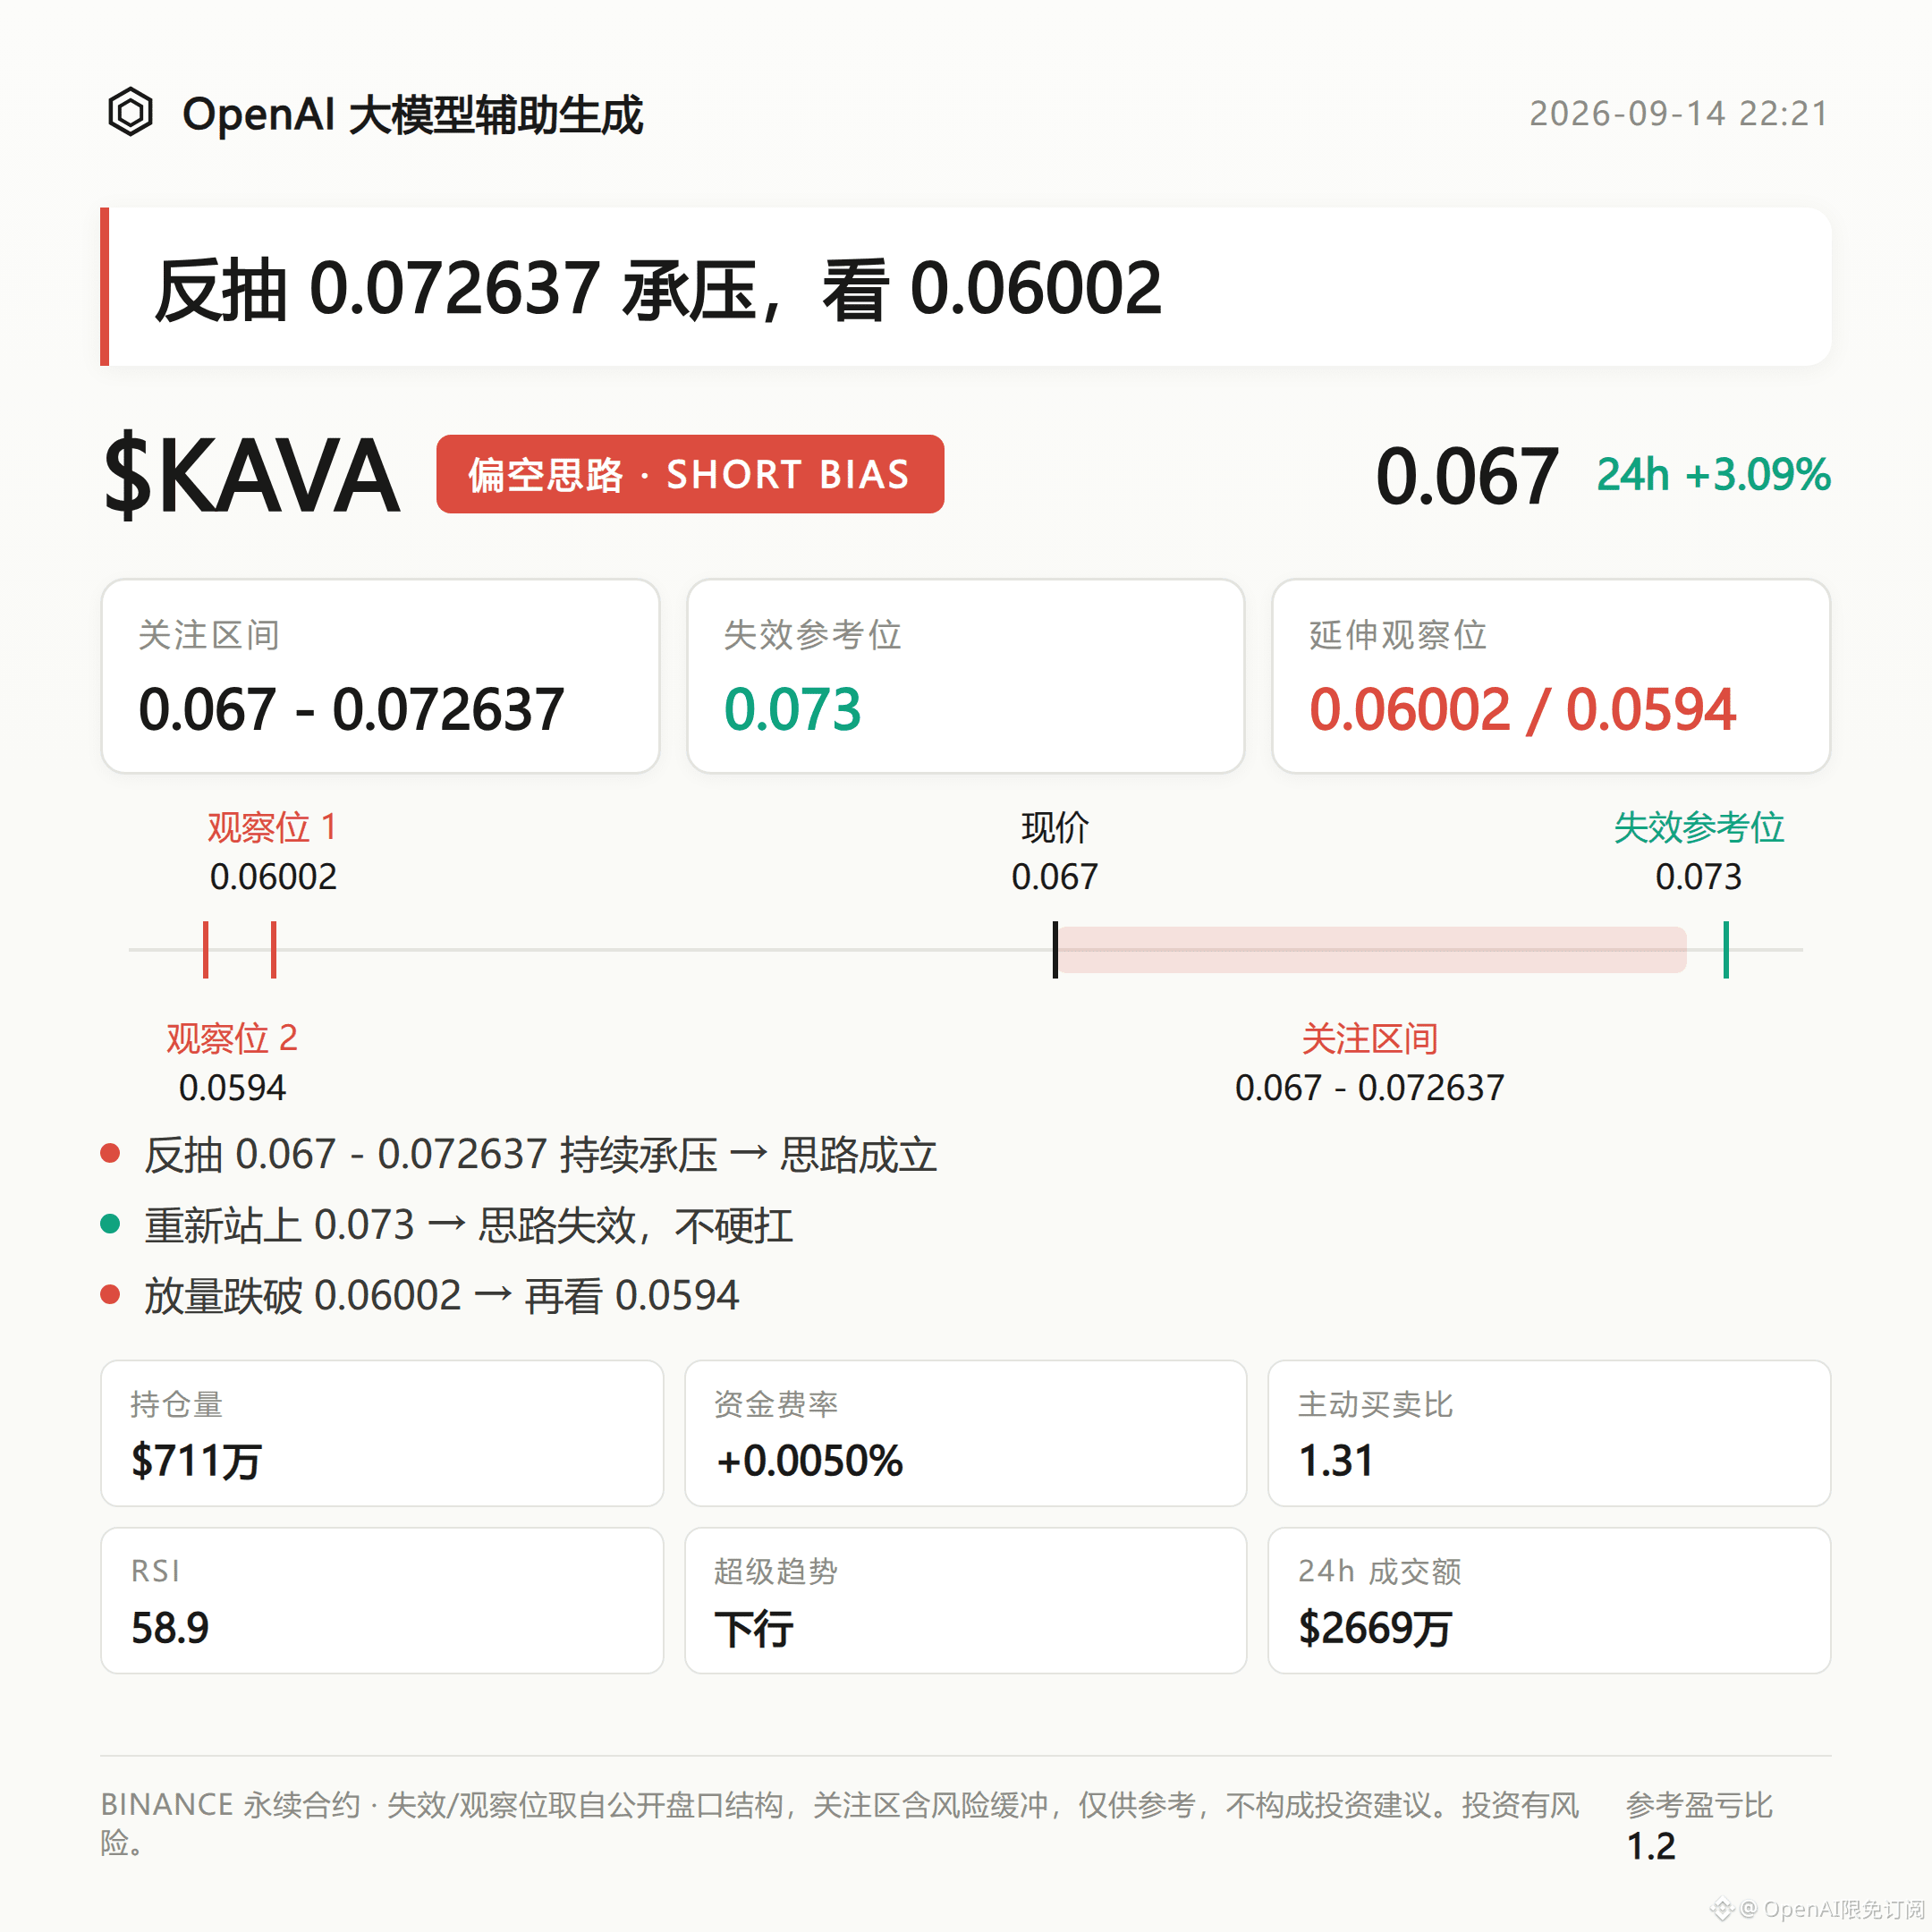
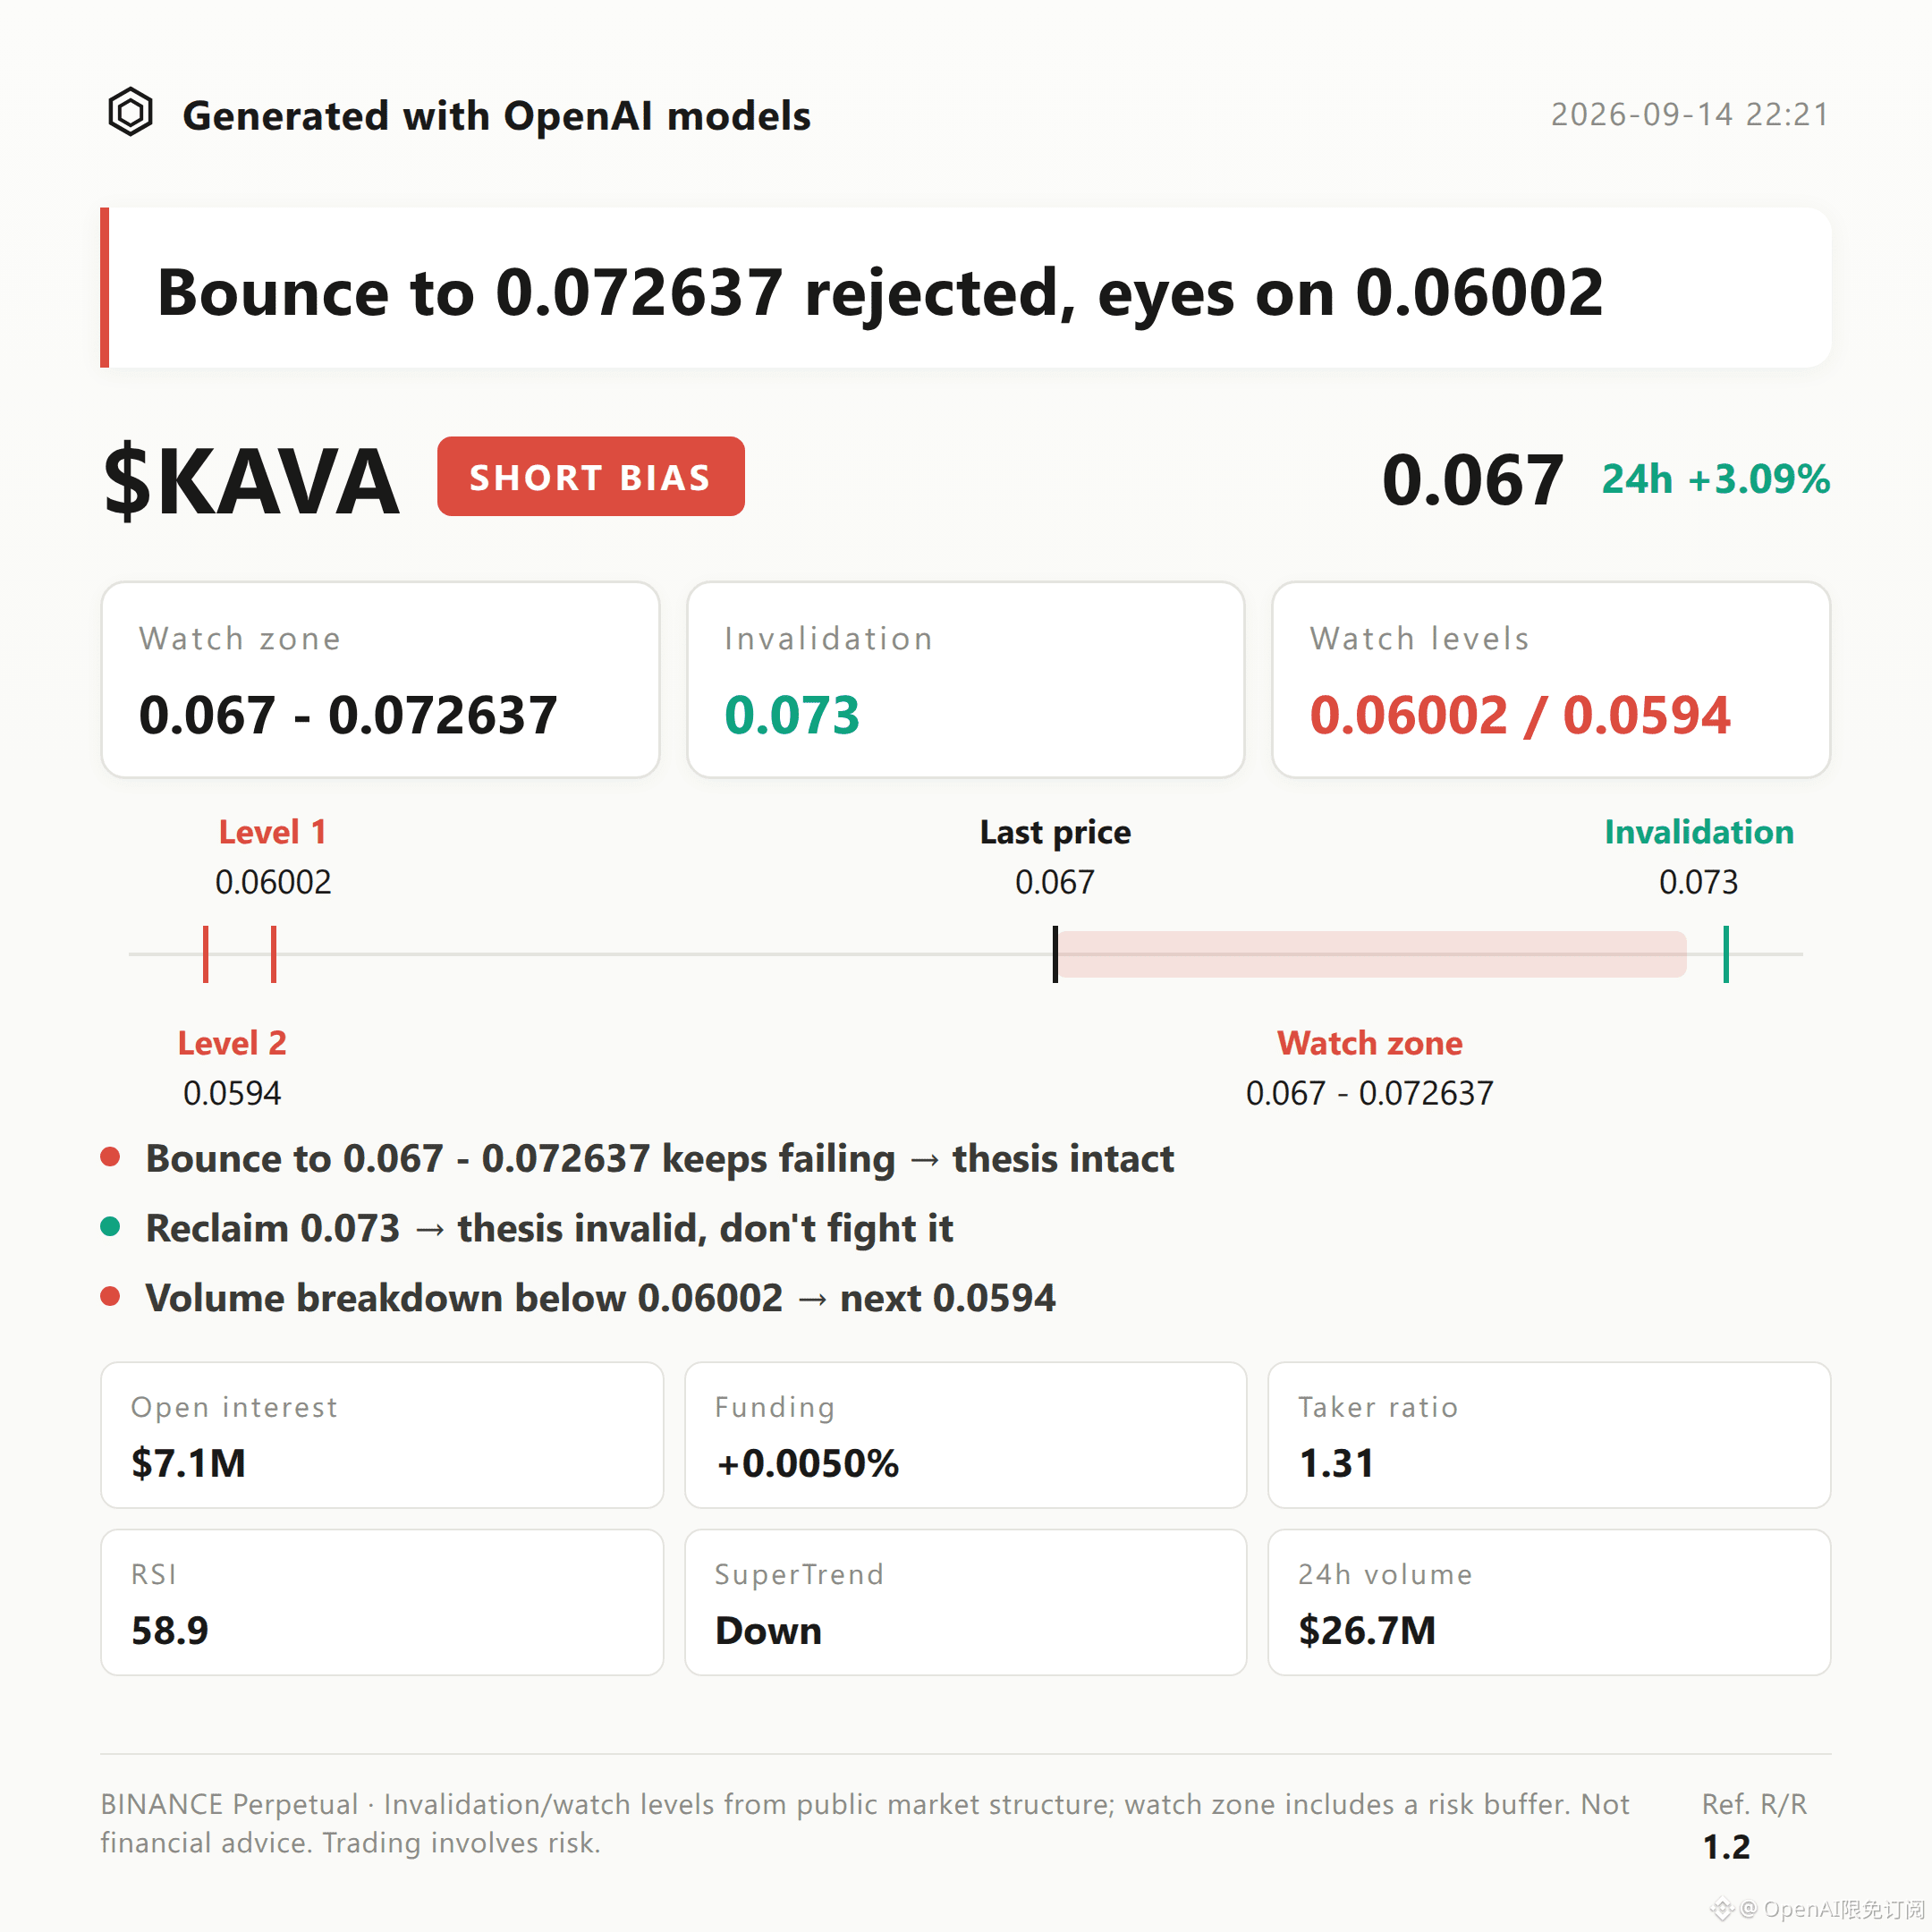
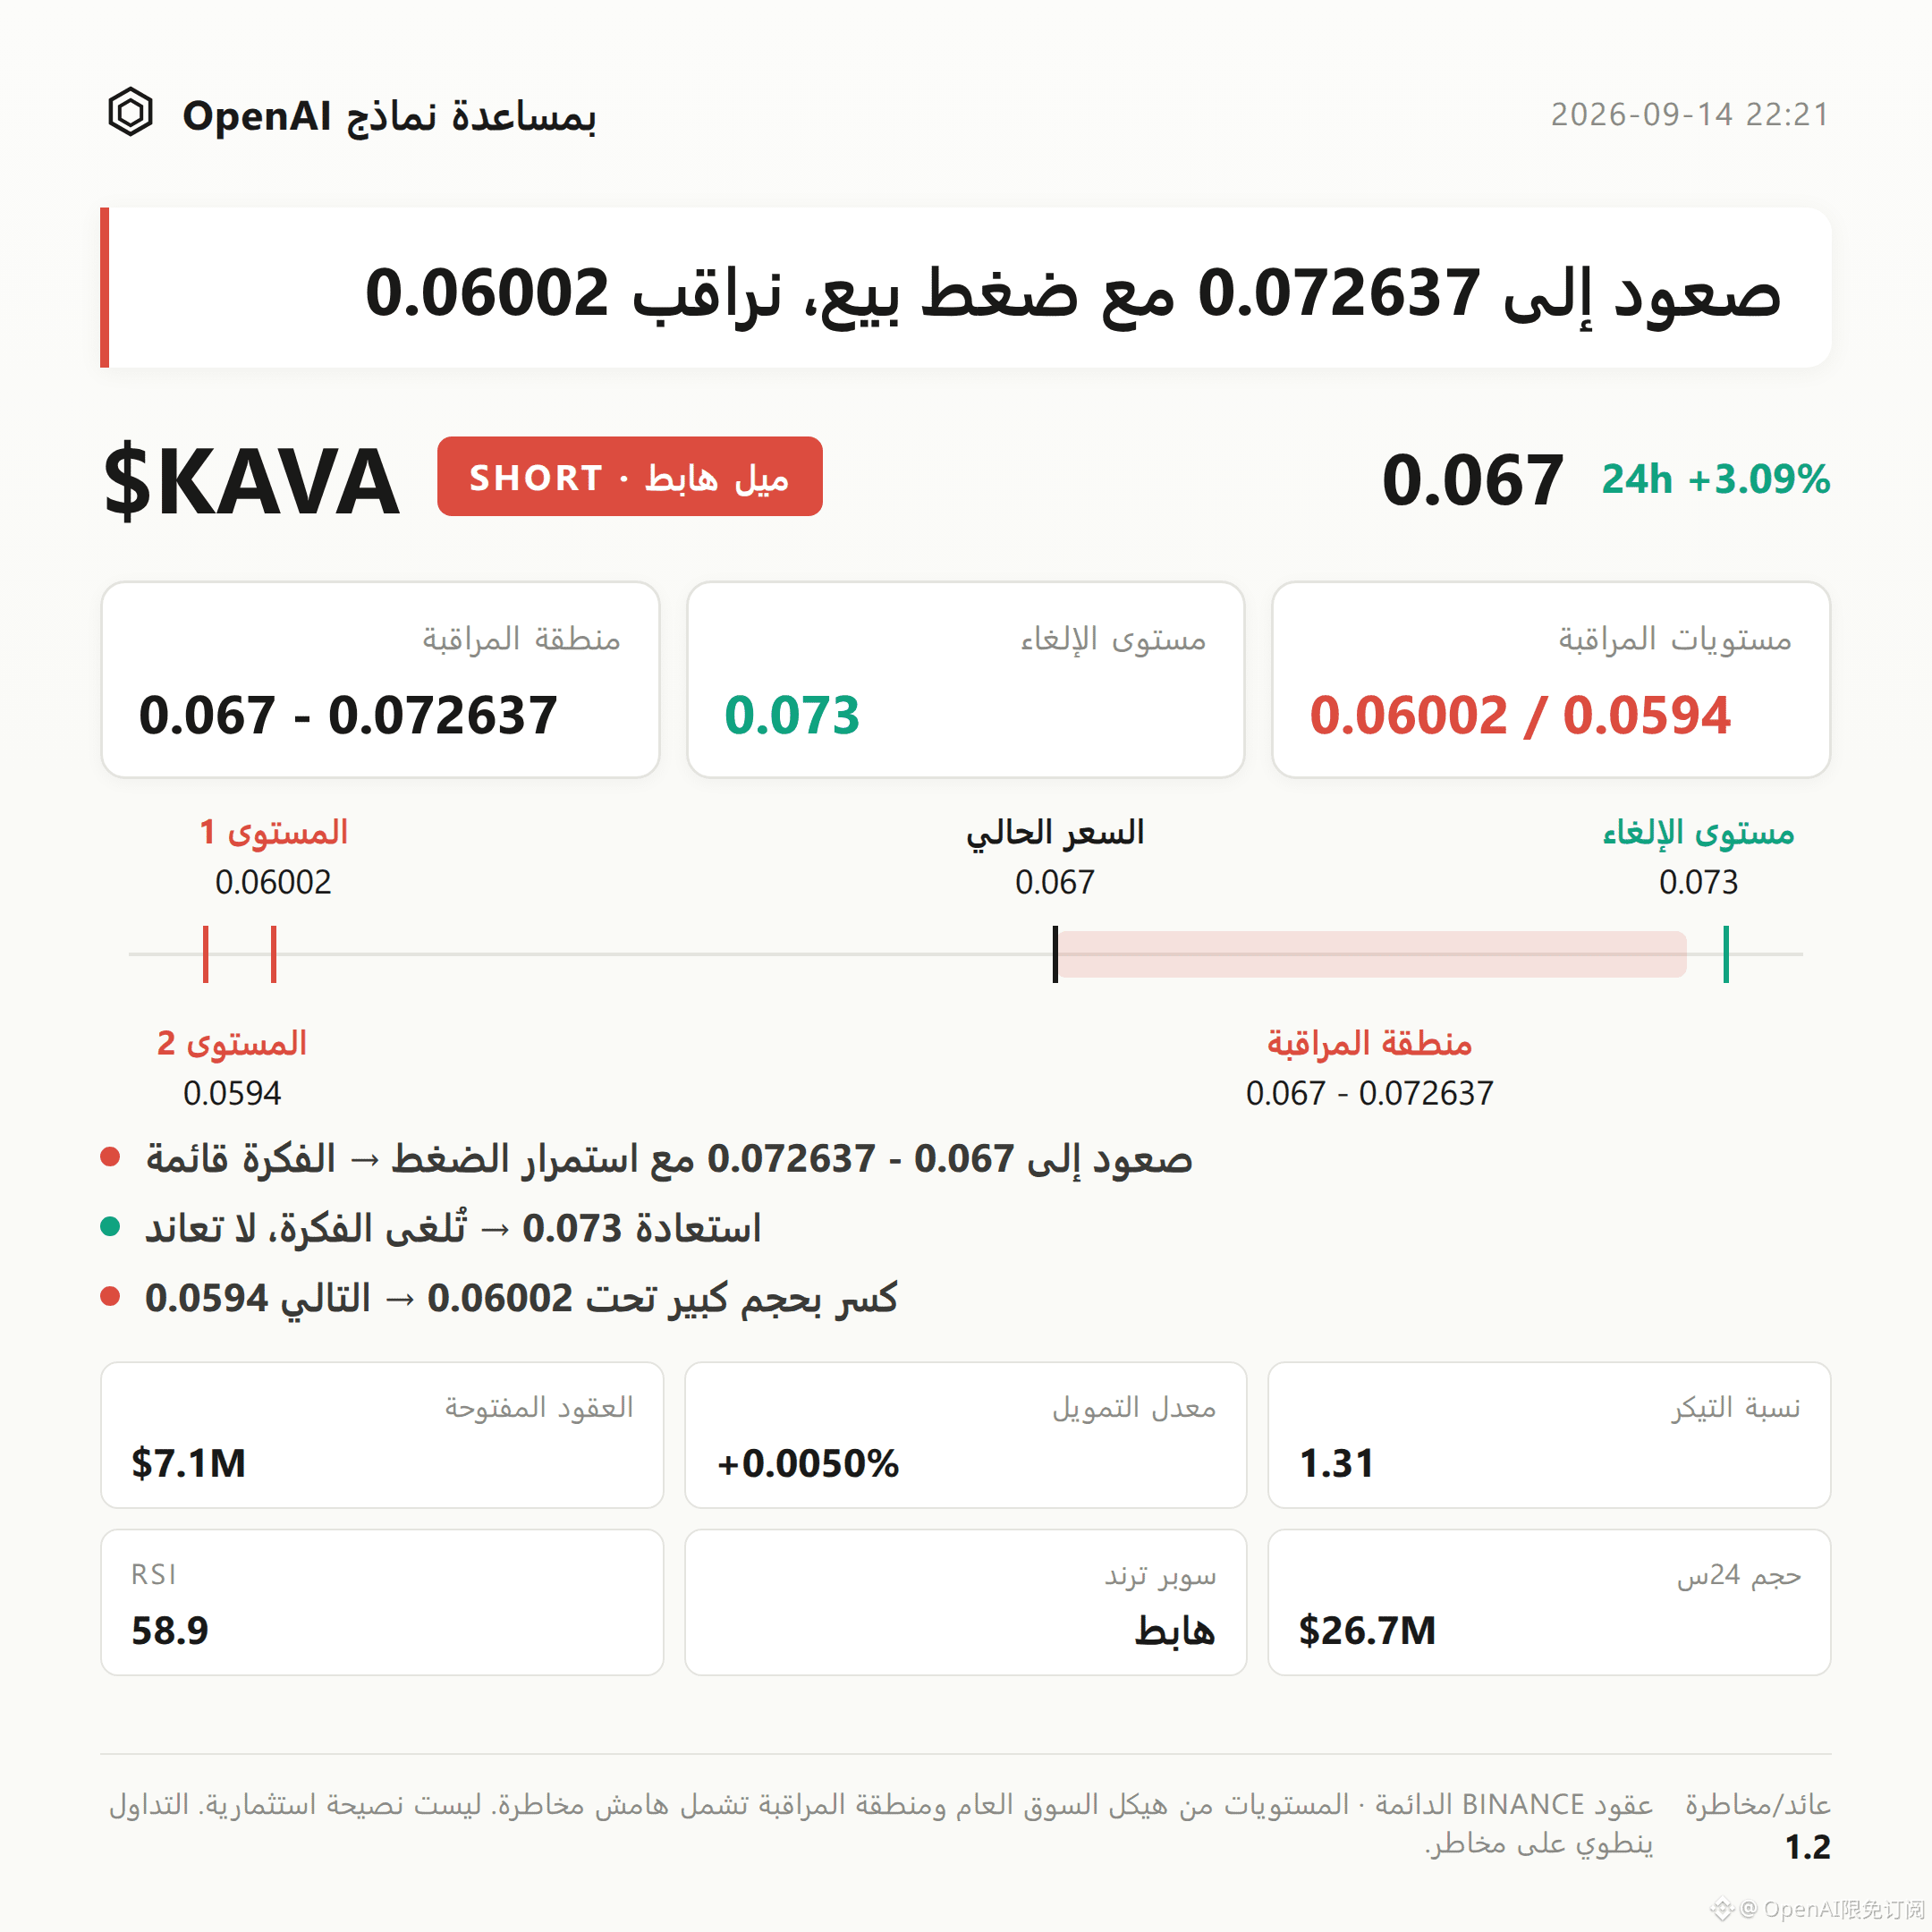
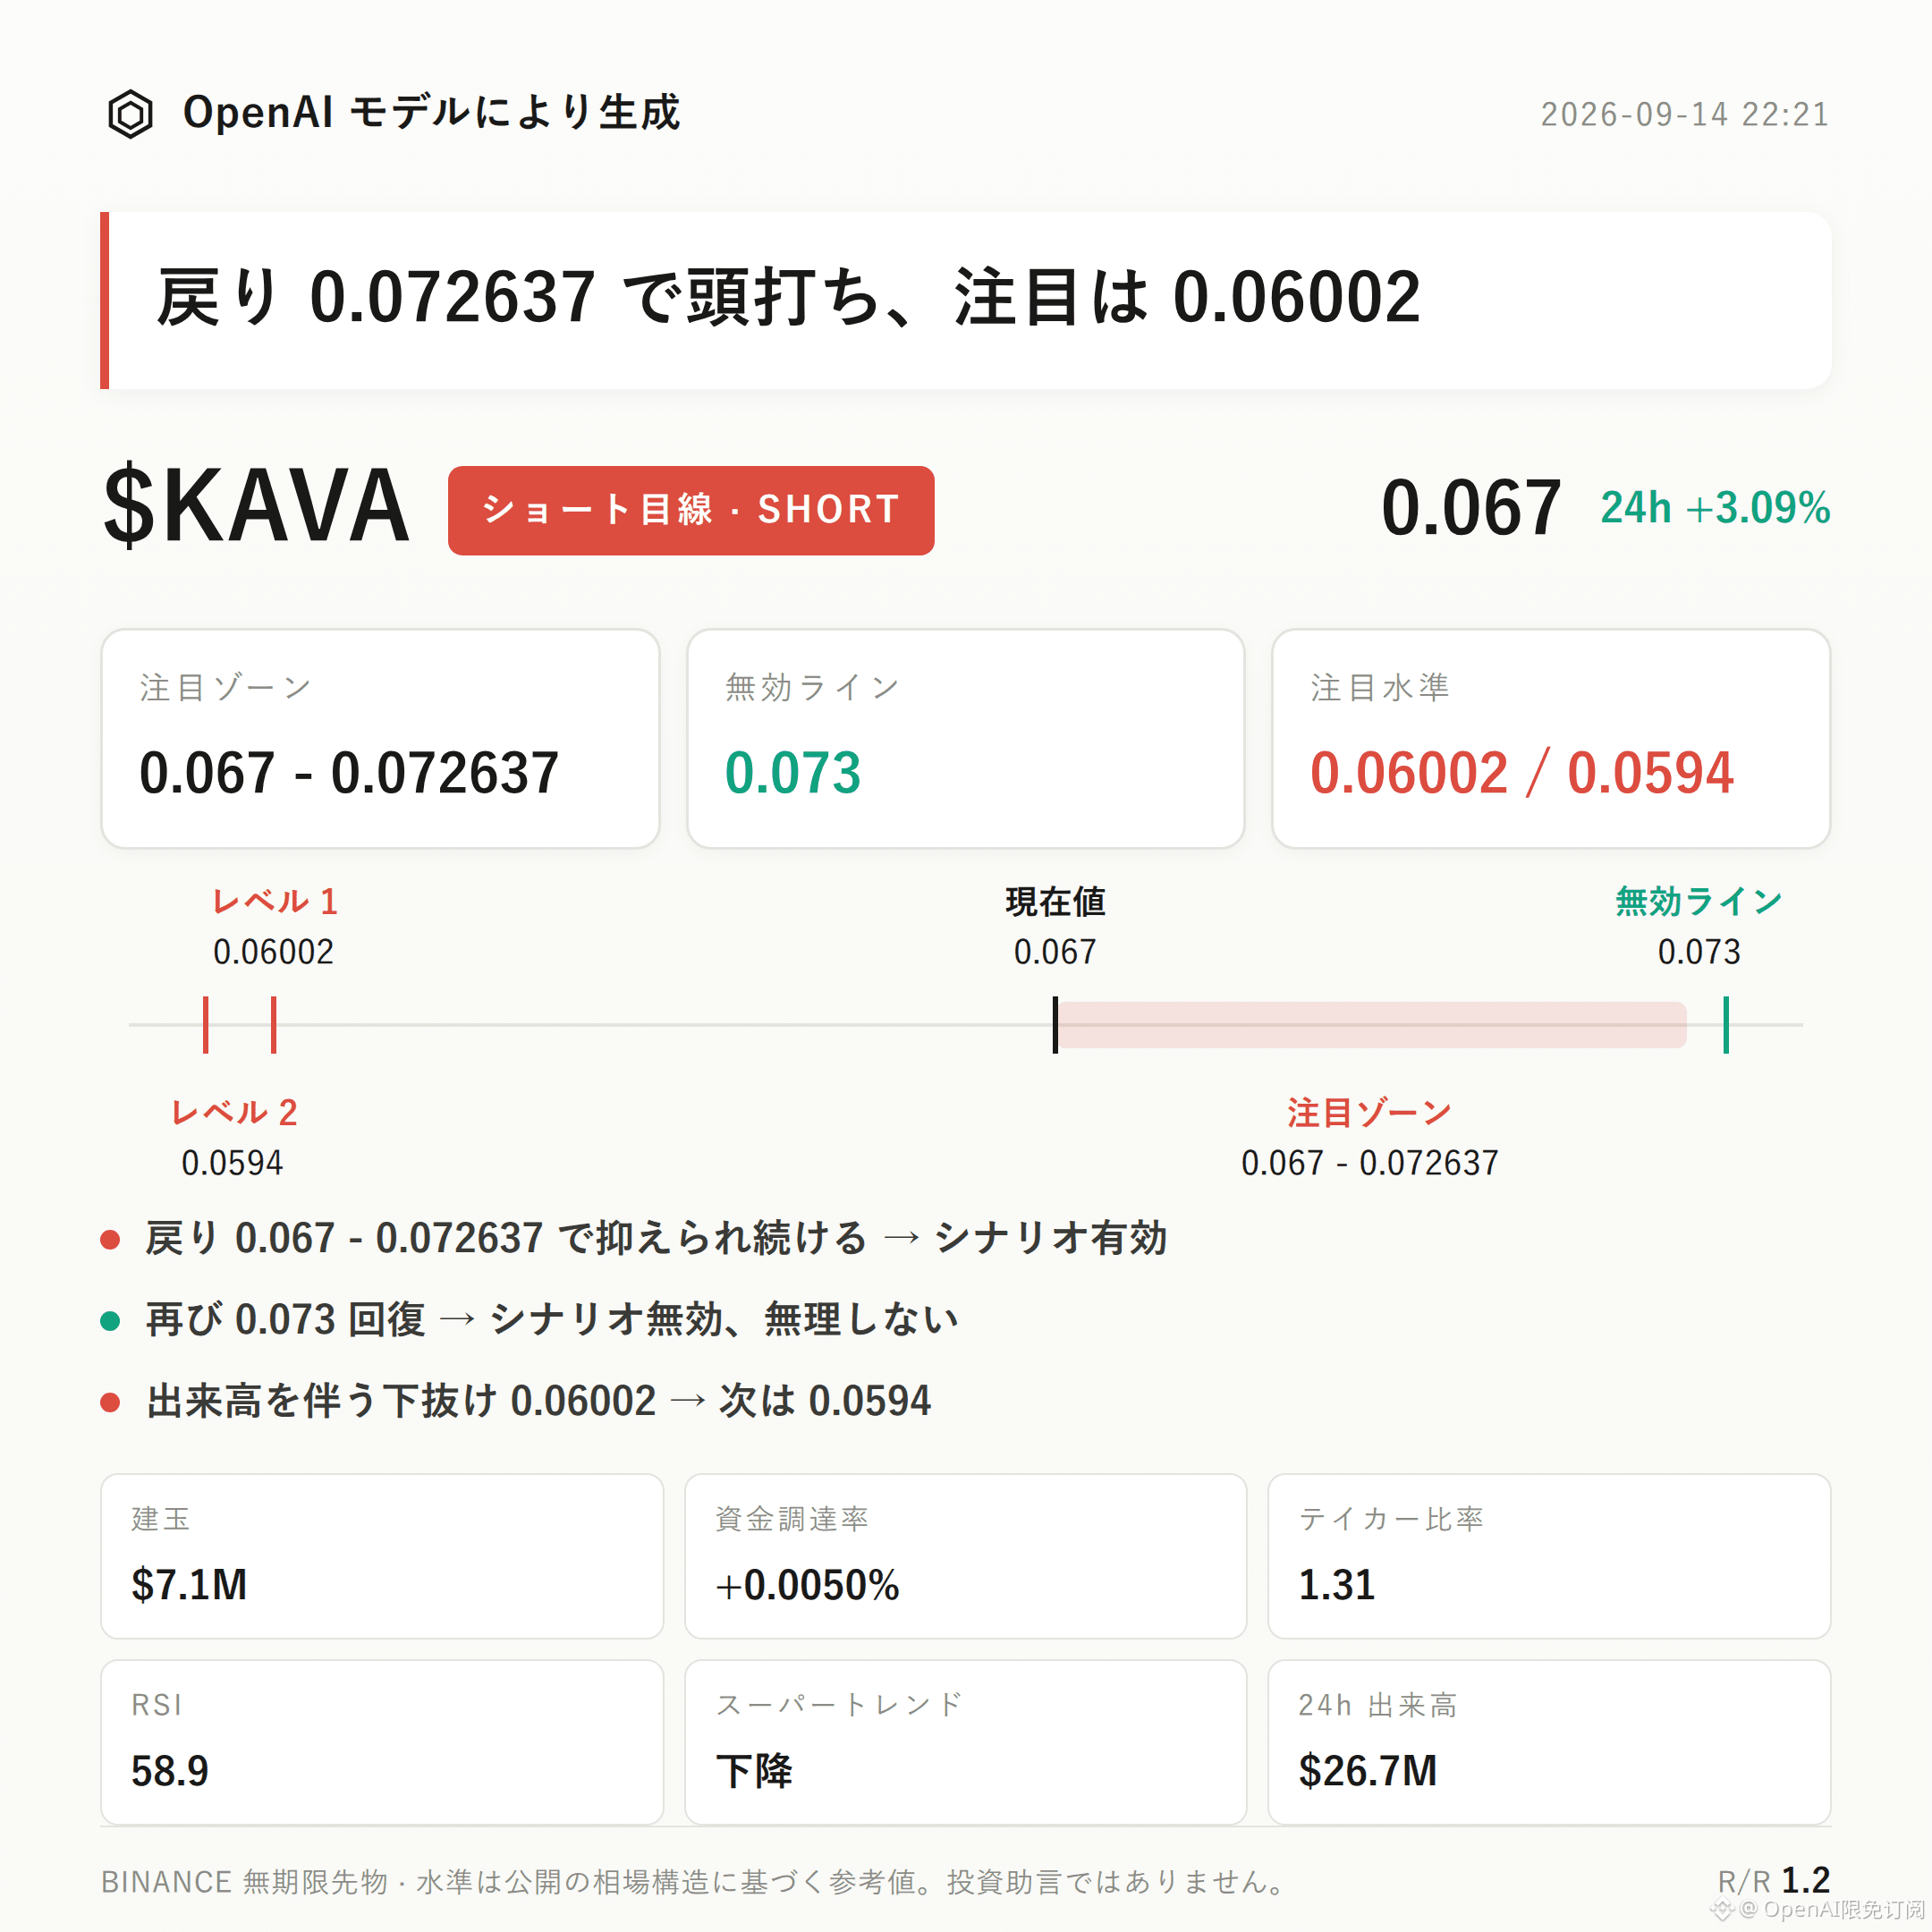
$KAVA Slightly bearish setup | Watch zone 0.067 - 0.072637 | Invalidation reference 0.073 | Key observation points 0.06002 / 0.0594
The current structure of $KAVA is moving in a bearish direction.
With the Super Trend still pointing down and MACD bearish momentum not yet exhausted, these are the two most convincing pieces of evidence in this wave’s structure observation.
The focus is whether the rebound can be suppressed within the pressure zone, and whether it can do so with increased volume.
The recent high at 0.073 and the recent low at 0.06002 form the fluctuation range for this current wave; the current price 0.067 is in the upper-mid portion of the range.
Bollinger Bands: upper 0.0661, middle 0.0627, lower 0.0594. Price has already moved near the upper band; short-term volatility has not yet tightened.
RSI reads 58.9—neutral to slightly strong, not yet entering the overbought zone.
MACD bearish momentum aligns with the Super Trend downward direction; this, together with the price’s short-term strength, creates a certain divergence—an important point to watch for a possible structural reversal.
In the last 24 hours, turnover is about $26.69 million, open interest about $7.11 million, and open interest change -0.9%—limited willingness to add positions.
Funding rate is +0.0050%, in a low range; long positions’ entry costs are not high.
Long/short account ratio: longs are 42%, and the account structure does not show a clearly bullish bias.
Active buy/sell ratio is 1.31—active bids are stronger than asks, and there is some disagreement on the derivatives side. This is discussed further in the risk section below.
If the rebound reaches the 0.067-0.072637 watch zone and then is rejected and falls again, treat it as pressure being validated, and the bearish setup remains valid. This zone is better for waiting for confirmation rather than chasing entries.
If the price rises back above 0.073, it indicates the current pullback structure has been broken; the bearish setup should be considered invalid and should not be watched in this direction anymore.
If the price further dips and breaks below 0.06002 with increased volume, the next observation support can be set around 0.0594.
What needs to be actively disclosed is that the active buy/sell ratio is 1.31, and the buy-side strength is still greater than the sell-side. This conflicts somewhat with the bearish momentum shown by the Super Trend and MACD—this is the main adverse risk facing this setup.
If the watch zone cannot effectively bear pressure, or if buying remains persistently strong, the current structure could be broken at any time. The reference risk/reward of 1.2 also suggests the room for profit itself is limited.
With contract leverage, position discipline is more important than directional judgment.
Live trade disclosure: This account currently holds a long position $FOGO ; structurally, I continue to look for longs, and my view matches the position.
For reference only and does not constitute investment advice. Contracts are leveraged—trading involves risk.
This article was generated with assistance from an OpenAI large model.
$KAVA #Contract analysis
$KAVA Slightly bearish setup | Watch zone 0.067 - 0.072637 | Invalidation reference 0.073 | Key observation points 0.06002 / 0.0594
The current structure of $KAVA is moving in a bearish direction.
With the Super Trend still pointing down and MACD bearish momentum not yet exhausted, these are the two most convincing pieces of evidence in this wave’s structure observation.
The focus is whether the rebound can be suppressed within the pressure zone, and whether it can do so with increased volume.
The recent high at 0.073 and the recent low at 0.06002 form the fluctuation range for this current wave; the current price 0.067 is in the upper-mid portion of the range.
Bollinger Bands: upper 0.0661, middle 0.0627, lower 0.0594. Price has already moved near the upper band; short-term volatility has not yet tightened.
RSI reads 58.9—neutral to slightly strong, not yet entering the overbought zone.
MACD bearish momentum aligns with the Super Trend downward direction; this, together with the price’s short-term strength, creates a certain divergence—an important point to watch for a possible structural reversal.
In the last 24 hours, turnover is about $26.69 million, open interest about $7.11 million, and open interest change -0.9%—limited willingness to add positions.
Funding rate is +0.0050%, in a low range; long positions’ entry costs are not high.
Long/short account ratio: longs are 42%, and the account structure does not show a clearly bullish bias.
Active buy/sell ratio is 1.31—active bids are stronger than asks, and there is some disagreement on the derivatives side. This is discussed further in the risk section below.
If the rebound reaches the 0.067-0.072637 watch zone and then is rejected and falls again, treat it as pressure being validated, and the bearish setup remains valid. This zone is better for waiting for confirmation rather than chasing entries.
If the price rises back above 0.073, it indicates the current pullback structure has been broken; the bearish setup should be considered invalid and should not be watched in this direction anymore.
If the price further dips and breaks below 0.06002 with increased volume, the next observation support can be set around 0.0594.
What needs to be actively disclosed is that the active buy/sell ratio is 1.31, and the buy-side strength is still greater than the sell-side. This conflicts somewhat with the bearish momentum shown by the Super Trend and MACD—this is the main adverse risk facing this setup.
If the watch zone cannot effectively bear pressure, or if buying remains persistently strong, the current structure could be broken at any time. The reference risk/reward of 1.2 also suggests the room for profit itself is limited.
With contract leverage, position discipline is more important than directional judgment.
Live trade disclosure: This account currently holds a long position $FOGO ; structurally, I continue to look for longs, and my view matches the position.
For reference only and does not constitute investment advice. Contracts are leveraged—trading involves risk.
This article was generated with assistance from an OpenAI large model.
$KAVA #Contract analysis