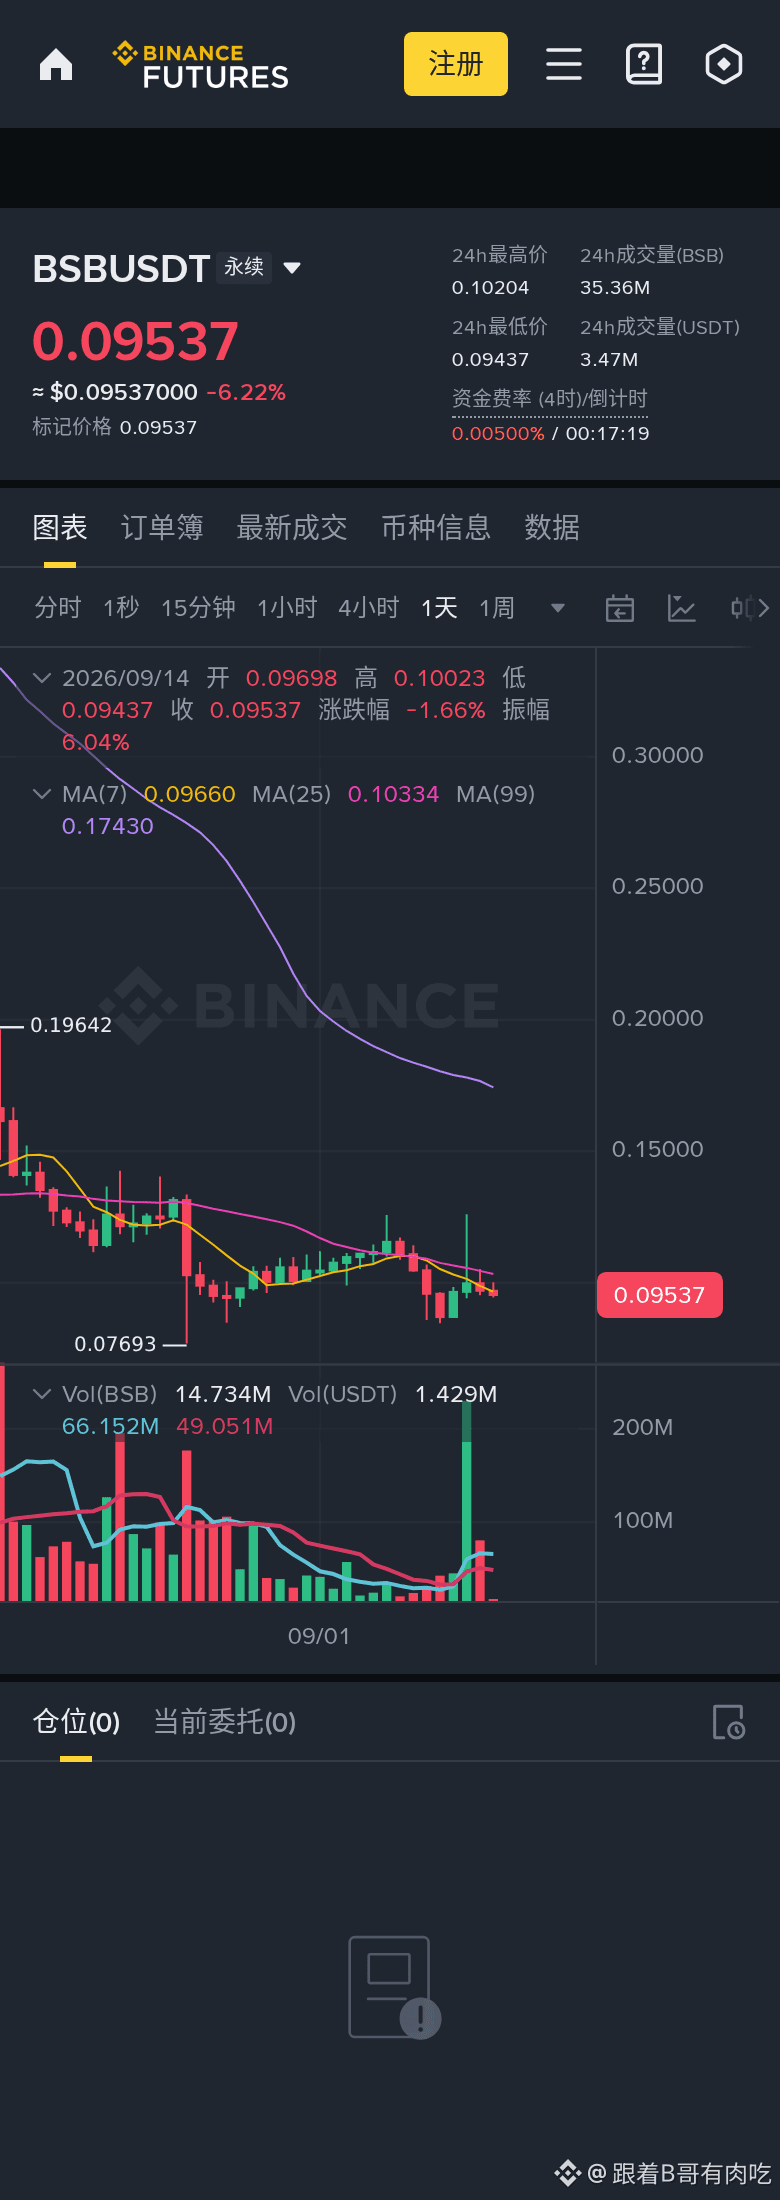
BSB What to do today? Daily chart gives the answer
Someone in the group asked again whether BSB can be entered. I just show the chart. Price is 0.09537, down -2.74% intraday. The daily RSI is 41.9. The fast/slow lines are in a bearish order, and the trendline has insufficient data. Key levels (daily): support 0.07693, resistance 0.1964. A bearish evening star at the end of an uptrend is a bearish signal—be cautious about chasing. When bearish signals appear but the moving averages aren’t in sync, I’ll only trade with a light position at most, not heavily betting on direction.
Trade plan: enter at 0.09537, set a stop-loss at 0.09823. First target: 0.07820 (R:R≈6.0:1). Position size: 1–2%.
Risk control: loss per single trade must not exceed 2% of principal. Always place the stop-loss. If the setup/formation fails, exit immediately—don’t hold and hope. If you want to see which coin, comment and I’ll break down the next one.
⚠️ Purely technical sharing, not investment advice. All gains and losses are your own responsibility. Crypto is highly volatile—make your own judgment and manage your risk.
#BSB #币安广场 #sideways consolidation
Someone in the group asked again whether BSB can be entered. I just show the chart. Price is 0.09537, down -2.74% intraday. The daily RSI is 41.9. The fast/slow lines are in a bearish order, and the trendline has insufficient data. Key levels (daily): support 0.07693, resistance 0.1964. A bearish evening star at the end of an uptrend is a bearish signal—be cautious about chasing. When bearish signals appear but the moving averages aren’t in sync, I’ll only trade with a light position at most, not heavily betting on direction.
Trade plan: enter at 0.09537, set a stop-loss at 0.09823. First target: 0.07820 (R:R≈6.0:1). Position size: 1–2%.
Risk control: loss per single trade must not exceed 2% of principal. Always place the stop-loss. If the setup/formation fails, exit immediately—don’t hold and hope. If you want to see which coin, comment and I’ll break down the next one.
⚠️ Purely technical sharing, not investment advice. All gains and losses are your own responsibility. Crypto is highly volatile—make your own judgment and manage your risk.
#BSB #币安广场 #sideways consolidation