$VVV How to analyze a duvet cover?🔥
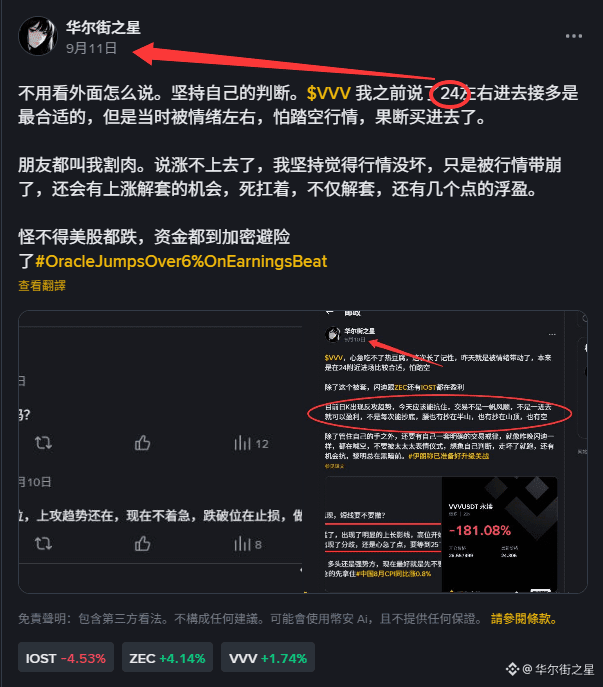
If you’ve read my previous blog posts, you already know that VVV made a precise prediction of an additional upswing. At the time, I thought 0.24 was the best entry point to buy the pullback. But I was influenced by FOMO/being late to the trade, and I entered a long position at 0.26, which ended up trapping me in a losing position.
On this coin, I still have the right to speak—if you’re trapped in this coin or can’t find a direction, you can take a look at my thoughts.
Although later I managed to get out of the trapped position, because I couldn’t hold back, my profit still got cut down significantly.
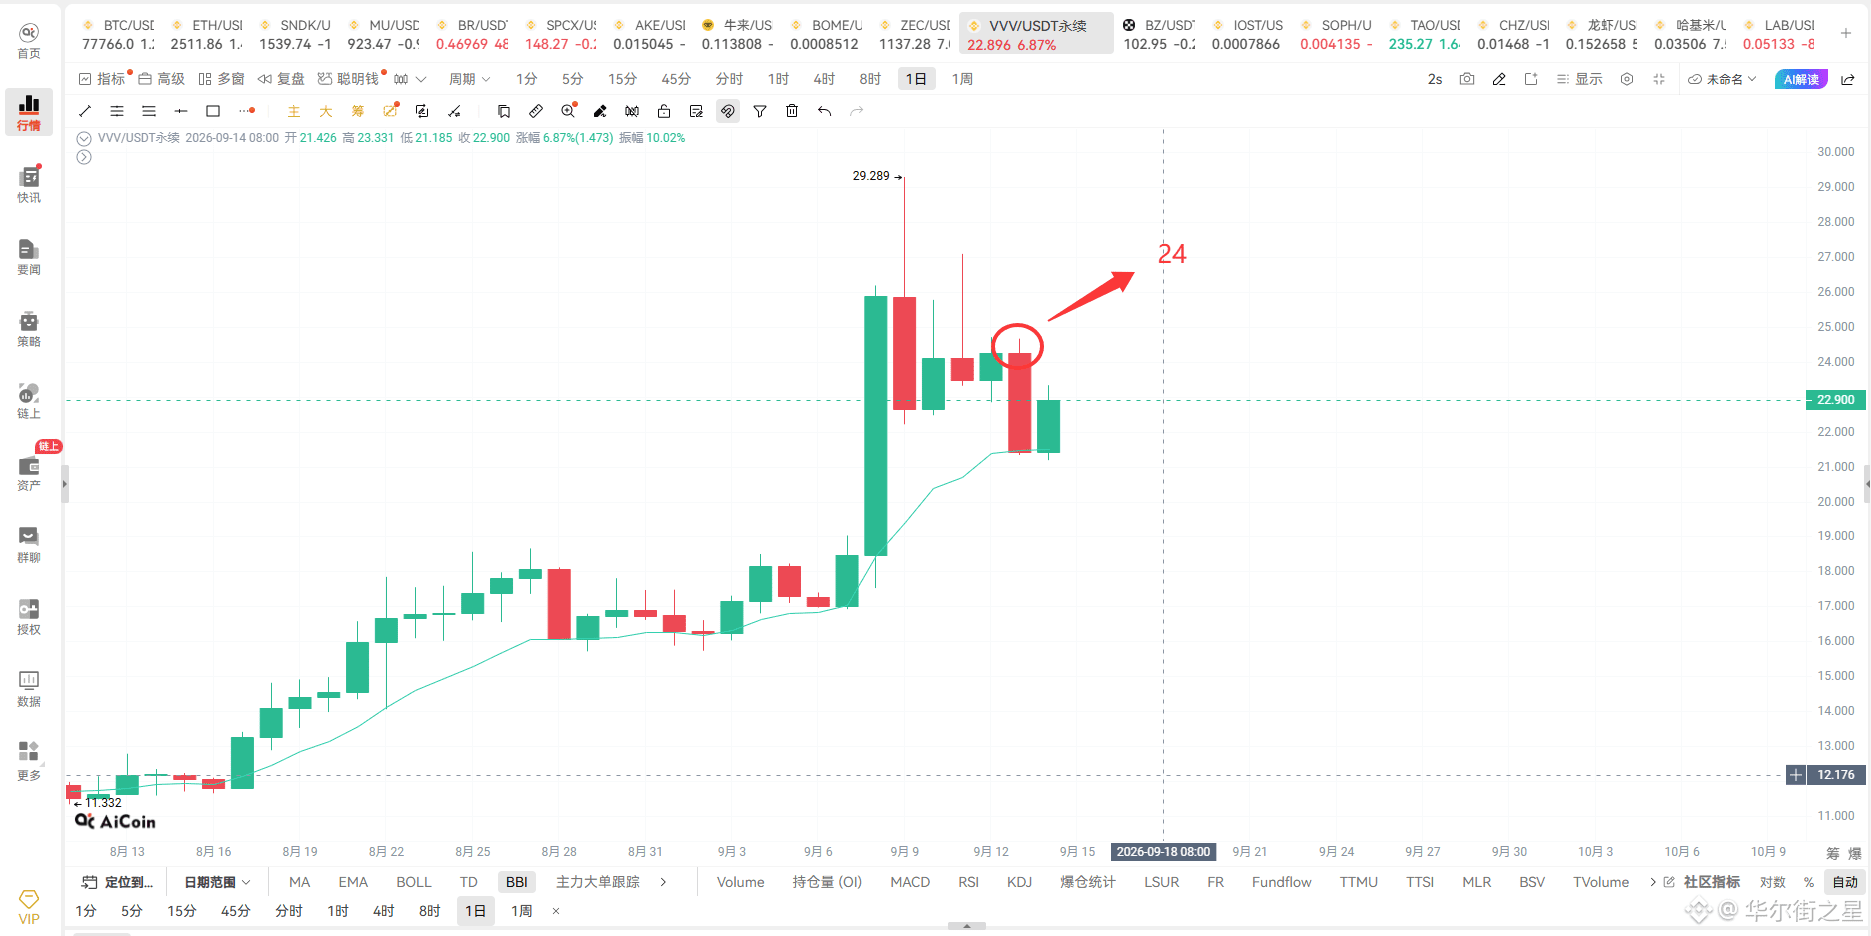
Why do I think the area around 0.24 is extremely critical? Looking at Chart 2, you can see multiple consecutive upper wicks forming beforehand, which indicates clear selling pressure there. That means it’s a short-term resistance level—a breakout confirmation level and the point where an upward move could be validated.
If this wave can reclaim and stand above 0.24 with increased volume, and the higher resistance level gets absorbed, then you can look again around 0.27. Once it holds 0.27, you can target the previous high direction at 0.29.
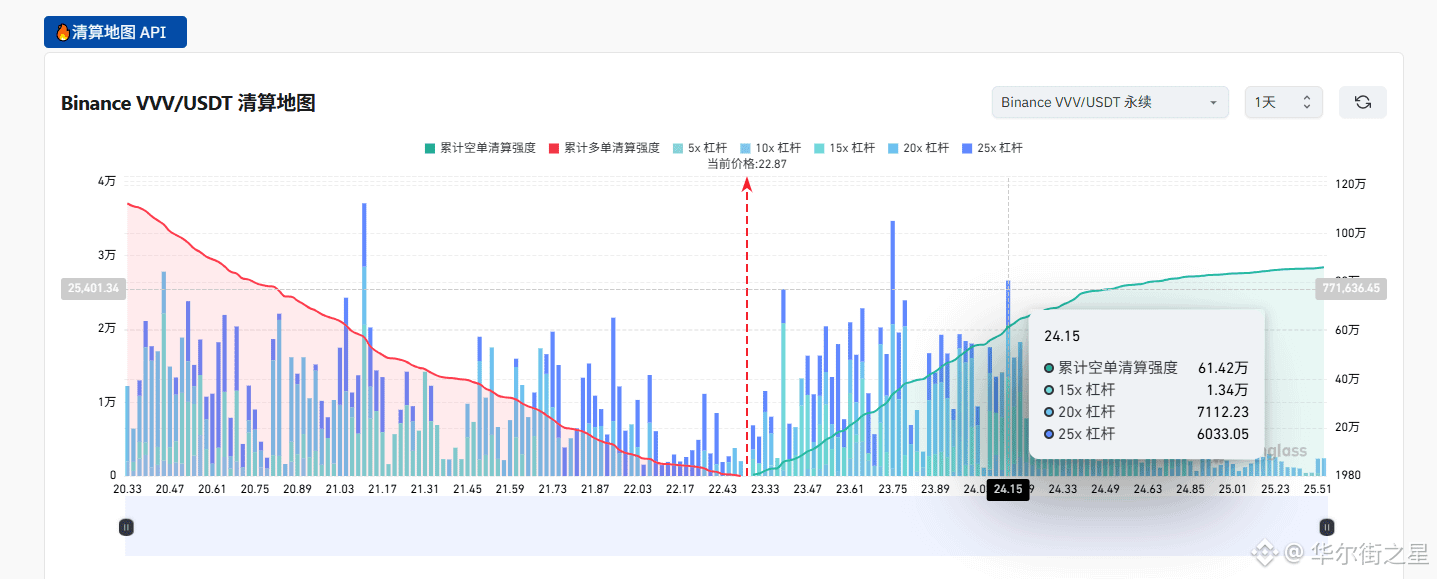
From Chart 3, the liquidation zone for long positions is densely concentrated around 0.22–0.21. If it breaks below 0.22, it may accelerate the short-selling trend. Long positions could then be used as “fuel” for mass liquidations—triggering and accelerating the short-side attack. Therefore, if it drops below 0.22, whether your long is trapped or just newly opened, you should cut losses in time. #美国存储芯片股盘前下跌
If you’ve read my previous blog posts, you already know that VVV made a precise prediction of an additional upswing. At the time, I thought 0.24 was the best entry point to buy the pullback. But I was influenced by FOMO/being late to the trade, and I entered a long position at 0.26, which ended up trapping me in a losing position.
On this coin, I still have the right to speak—if you’re trapped in this coin or can’t find a direction, you can take a look at my thoughts.
Although later I managed to get out of the trapped position, because I couldn’t hold back, my profit still got cut down significantly.
Why do I think the area around 0.24 is extremely critical? Looking at Chart 2, you can see multiple consecutive upper wicks forming beforehand, which indicates clear selling pressure there. That means it’s a short-term resistance level—a breakout confirmation level and the point where an upward move could be validated.
If this wave can reclaim and stand above 0.24 with increased volume, and the higher resistance level gets absorbed, then you can look again around 0.27. Once it holds 0.27, you can target the previous high direction at 0.29.
From Chart 3, the liquidation zone for long positions is densely concentrated around 0.22–0.21. If it breaks below 0.22, it may accelerate the short-selling trend. Long positions could then be used as “fuel” for mass liquidations—triggering and accelerating the short-side attack. Therefore, if it drops below 0.22, whether your long is trapped or just newly opened, you should cut losses in time. #美国存储芯片股盘前下跌