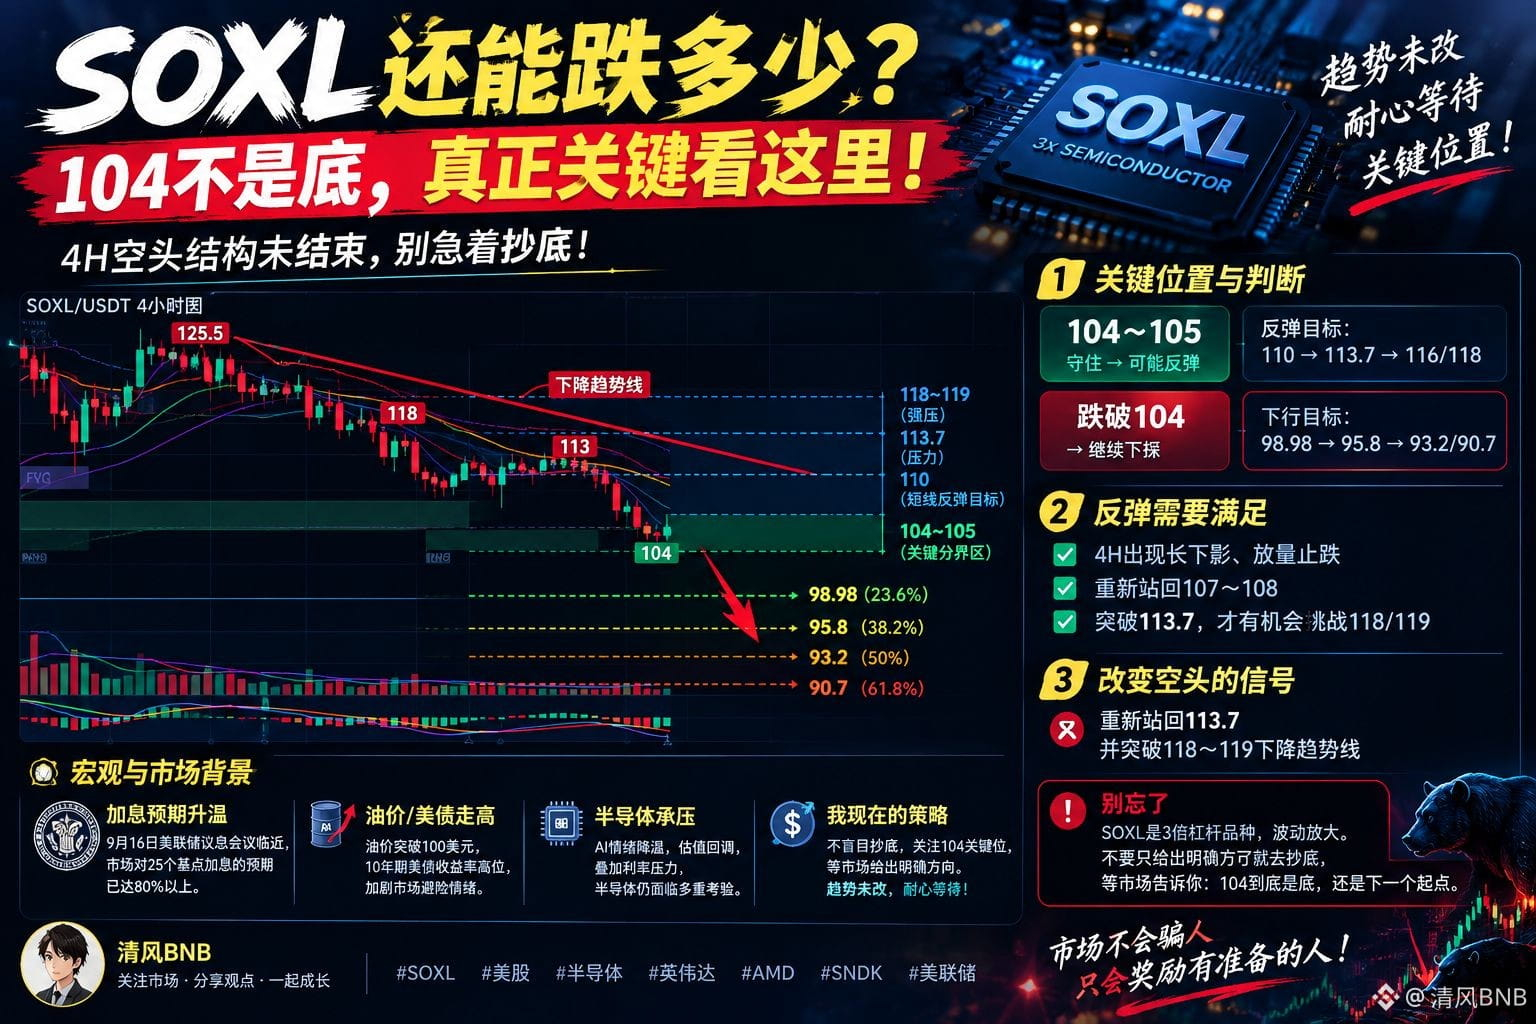
【How much further can SOXL fall? 104 isn’t the bottom—what really matters is here】
This time I don’t want to use the idea of “it’s fallen too much so it should bounce” to look at SOXL. Instead, I’ll directly read the 4H market structure.
After topping around 125.5, SOXL has already formed a very clear pattern of Lower High + Lower Low: 125.5 → 118 → 113 → 104. The red descending trendline continues to suppress price, which means the current 4H bearish structure hasn’t truly ended yet.
Now the most crucial zone is 104–105.
If around 104 you see a long lower wick, a reversal with increased volume, and then on the 4H chart price reclaims 107–108, then in the short term there may be a pullback/bounce. The first target would be 110; if it’s stronger, look at 113.7. Above that is the resistance area at 116–118.
But if 104 breaks down directly on high volume, don’t fantasize that this is definitely the bottom.
According to the Fibonacci extension of this leg, the first target below would be 98.98—this is the level I’m paying the most attention to right now. If 98.98 continues to be lost, the next target is 95.8. In extreme cases, it could even test 93.2–90.7.
What would truly make me change my bearish view isn’t just a rebound of a few points, but SOXL reclaiming 113.7 and then breaking above the 118–119 descending trendline.
So the script right now is very simple:
Hold 104 → look for a bounce;
Break 104 → look for 98.98;
Lose 98.98 → look for 95.8.
Especially considering that expectations for Fed rate hikes are heating up, the semiconductor sector is currently facing multiple pressures at once—valuation, interest rates, and AI sentiment.
SOXL is a 3x leveraged product. The bigger the drop, the more you can’t just bottom-pick solely because “it’s already fallen a lot.”
I’d rather wait for the market to tell me whether 104 is truly the bottom, or the starting point for the next round of downside: #特朗普就CLARITY法案条款存疑 #白宫拒绝放缓AI发展呼吁 $SOXL
This time I don’t want to use the idea of “it’s fallen too much so it should bounce” to look at SOXL. Instead, I’ll directly read the 4H market structure.
After topping around 125.5, SOXL has already formed a very clear pattern of Lower High + Lower Low: 125.5 → 118 → 113 → 104. The red descending trendline continues to suppress price, which means the current 4H bearish structure hasn’t truly ended yet.
Now the most crucial zone is 104–105.
If around 104 you see a long lower wick, a reversal with increased volume, and then on the 4H chart price reclaims 107–108, then in the short term there may be a pullback/bounce. The first target would be 110; if it’s stronger, look at 113.7. Above that is the resistance area at 116–118.
But if 104 breaks down directly on high volume, don’t fantasize that this is definitely the bottom.
According to the Fibonacci extension of this leg, the first target below would be 98.98—this is the level I’m paying the most attention to right now. If 98.98 continues to be lost, the next target is 95.8. In extreme cases, it could even test 93.2–90.7.
What would truly make me change my bearish view isn’t just a rebound of a few points, but SOXL reclaiming 113.7 and then breaking above the 118–119 descending trendline.
So the script right now is very simple:
Hold 104 → look for a bounce;
Break 104 → look for 98.98;
Lose 98.98 → look for 95.8.
Especially considering that expectations for Fed rate hikes are heating up, the semiconductor sector is currently facing multiple pressures at once—valuation, interest rates, and AI sentiment.
SOXL is a 3x leveraged product. The bigger the drop, the more you can’t just bottom-pick solely because “it’s already fallen a lot.”
I’d rather wait for the market to tell me whether 104 is truly the bottom, or the starting point for the next round of downside: #特朗普就CLARITY法案条款存疑 #白宫拒绝放缓AI发展呼吁 $SOXL