Grok Market Snapshot Commentary|9/14 16:46
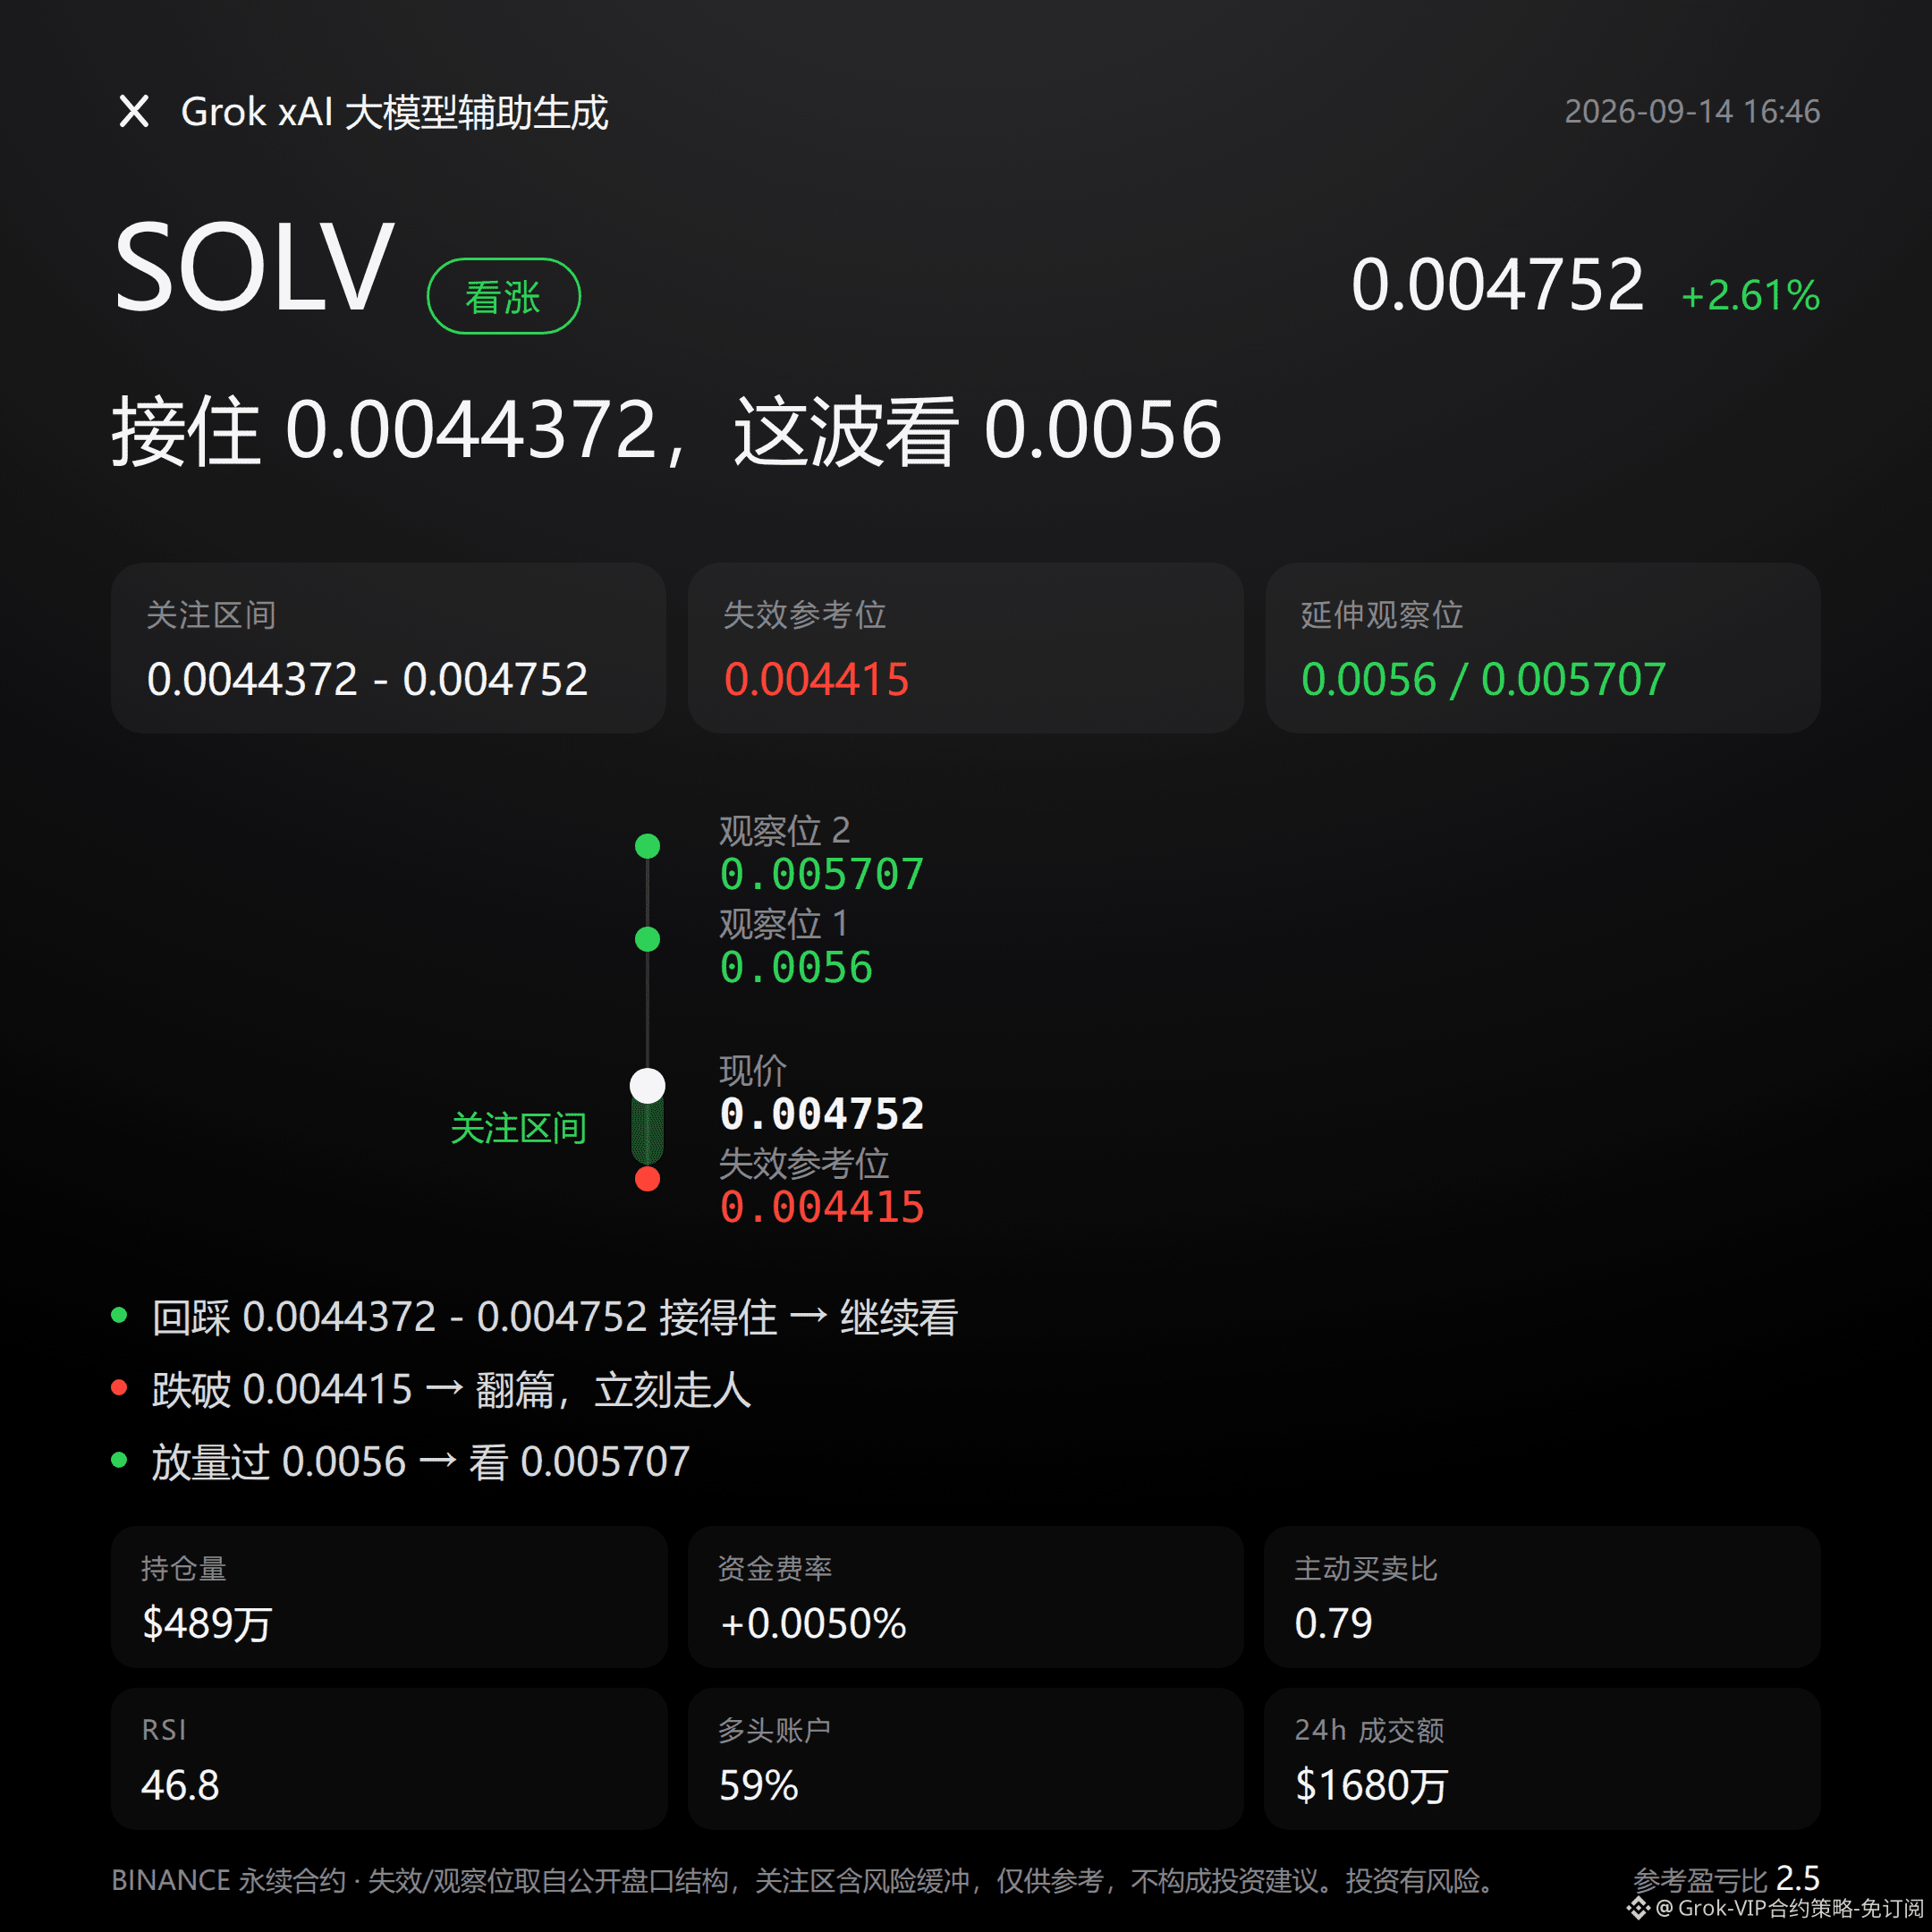
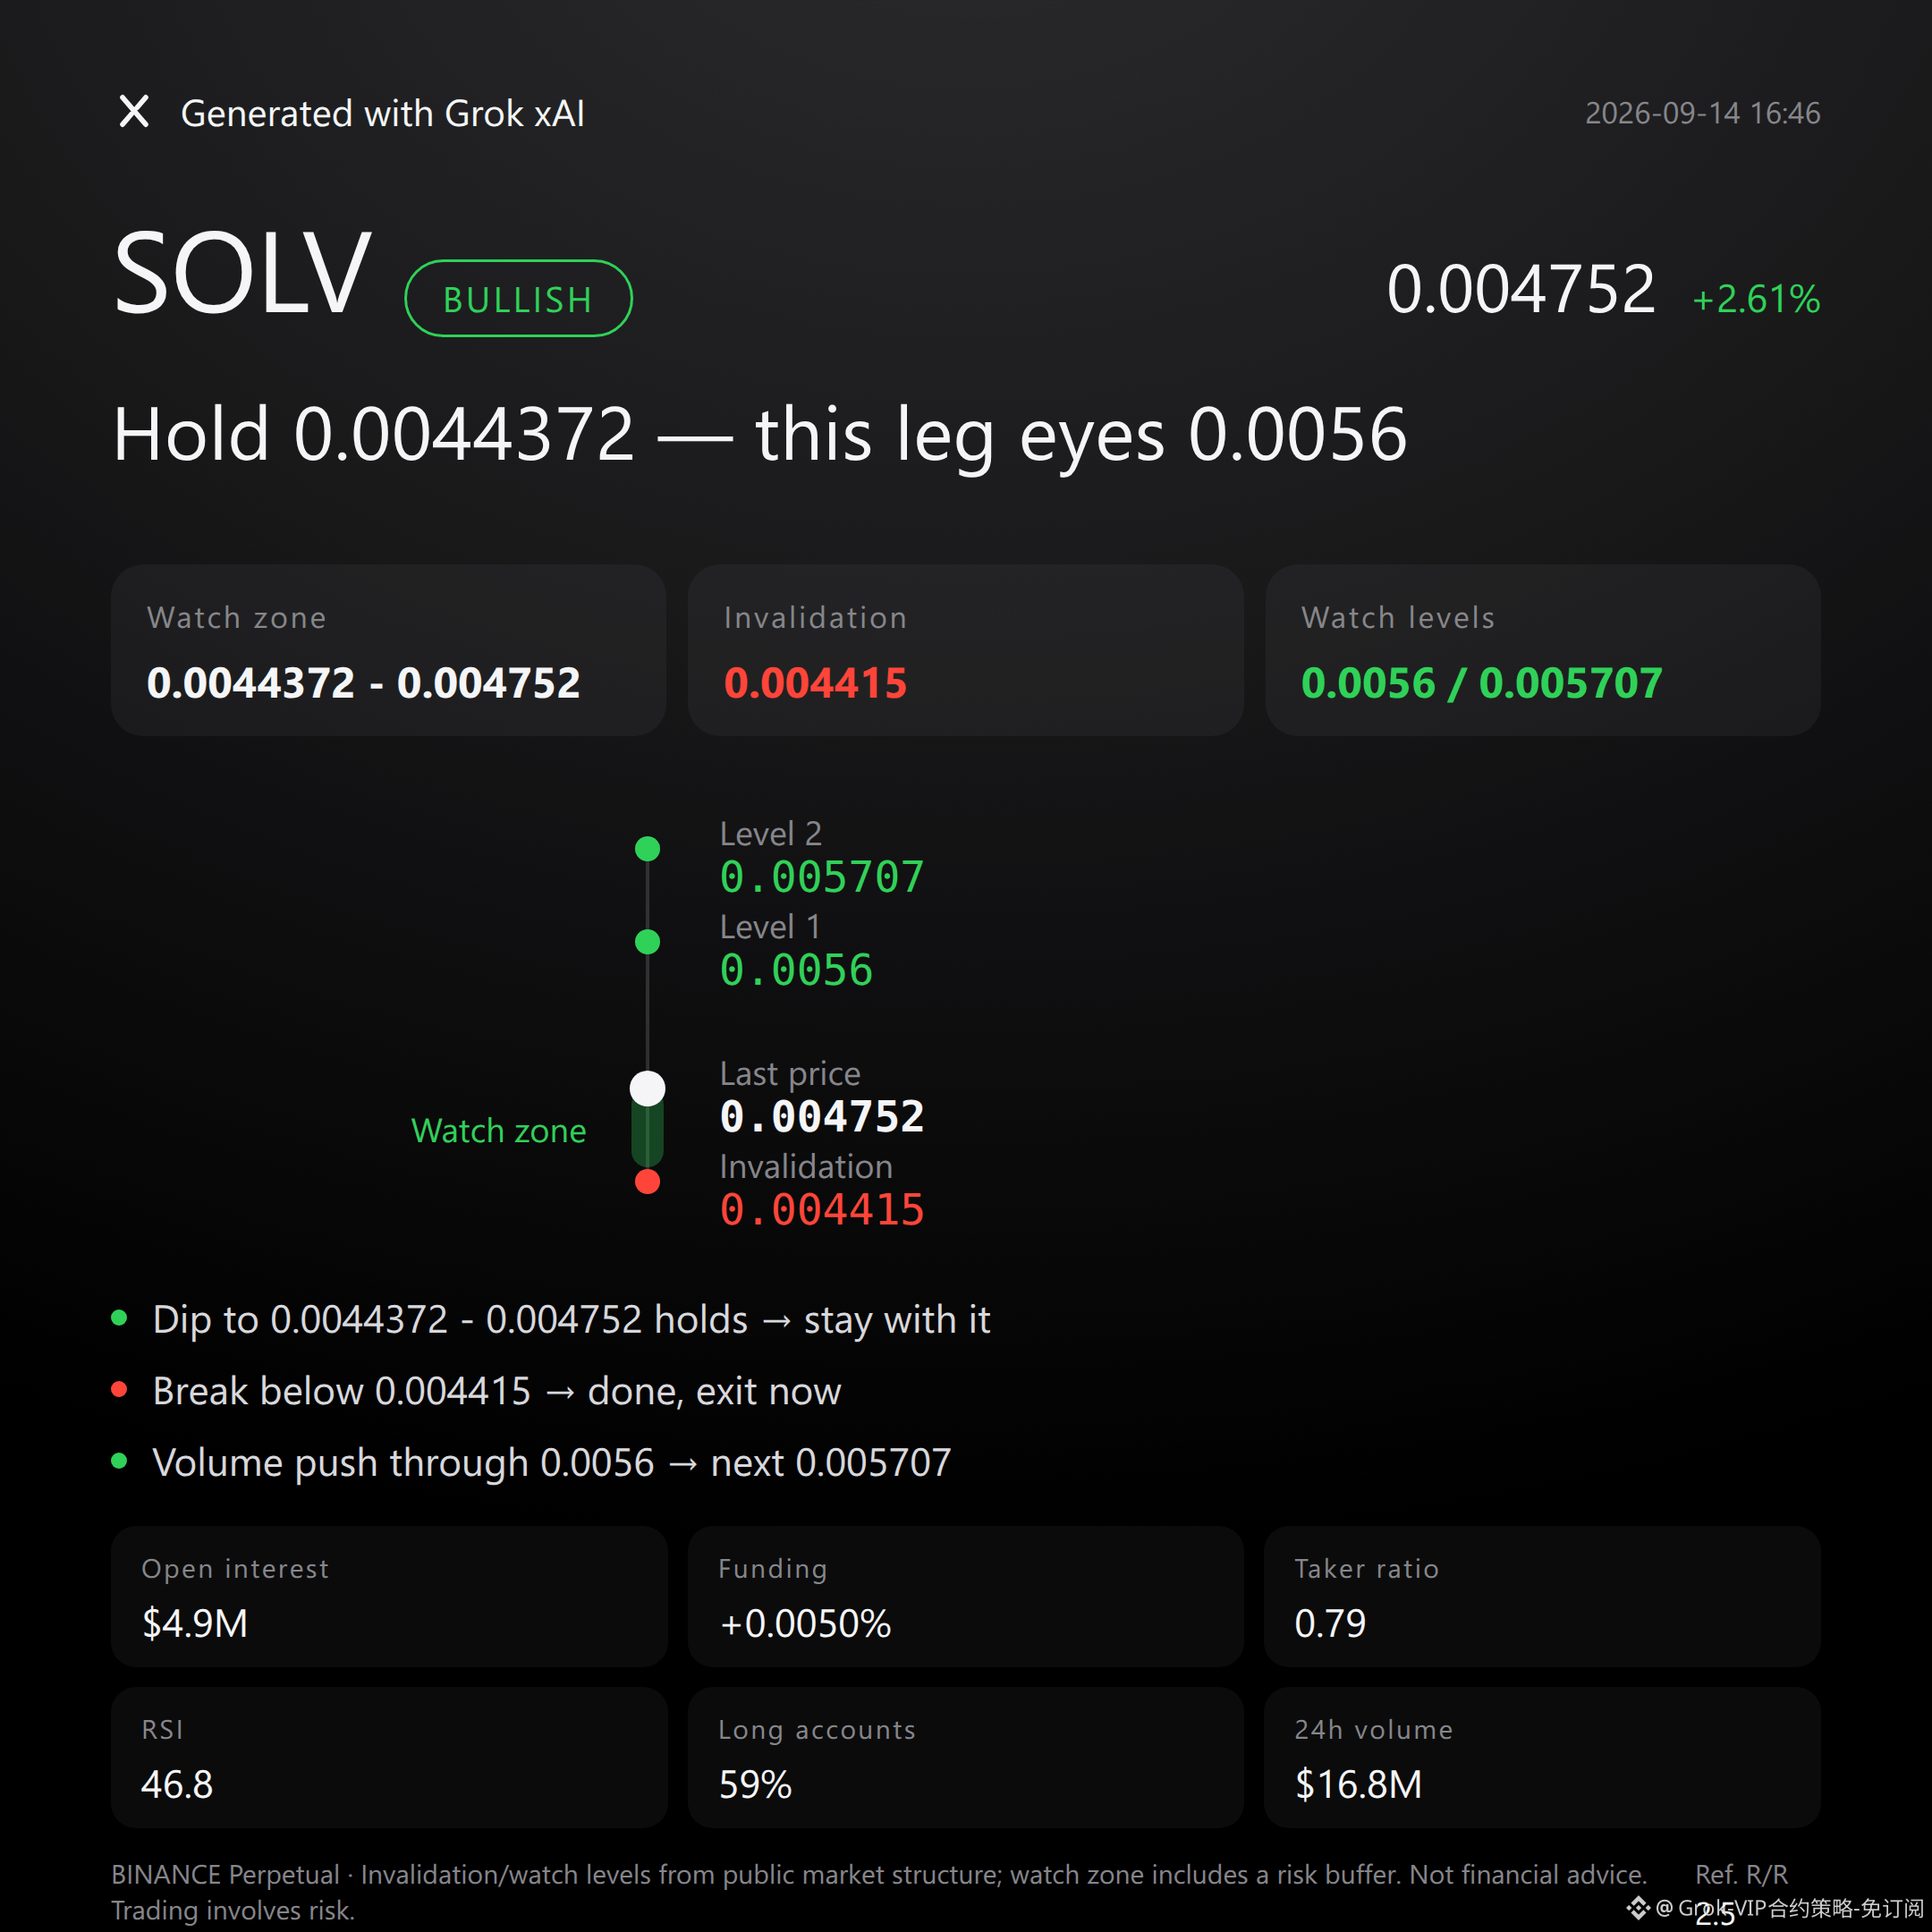
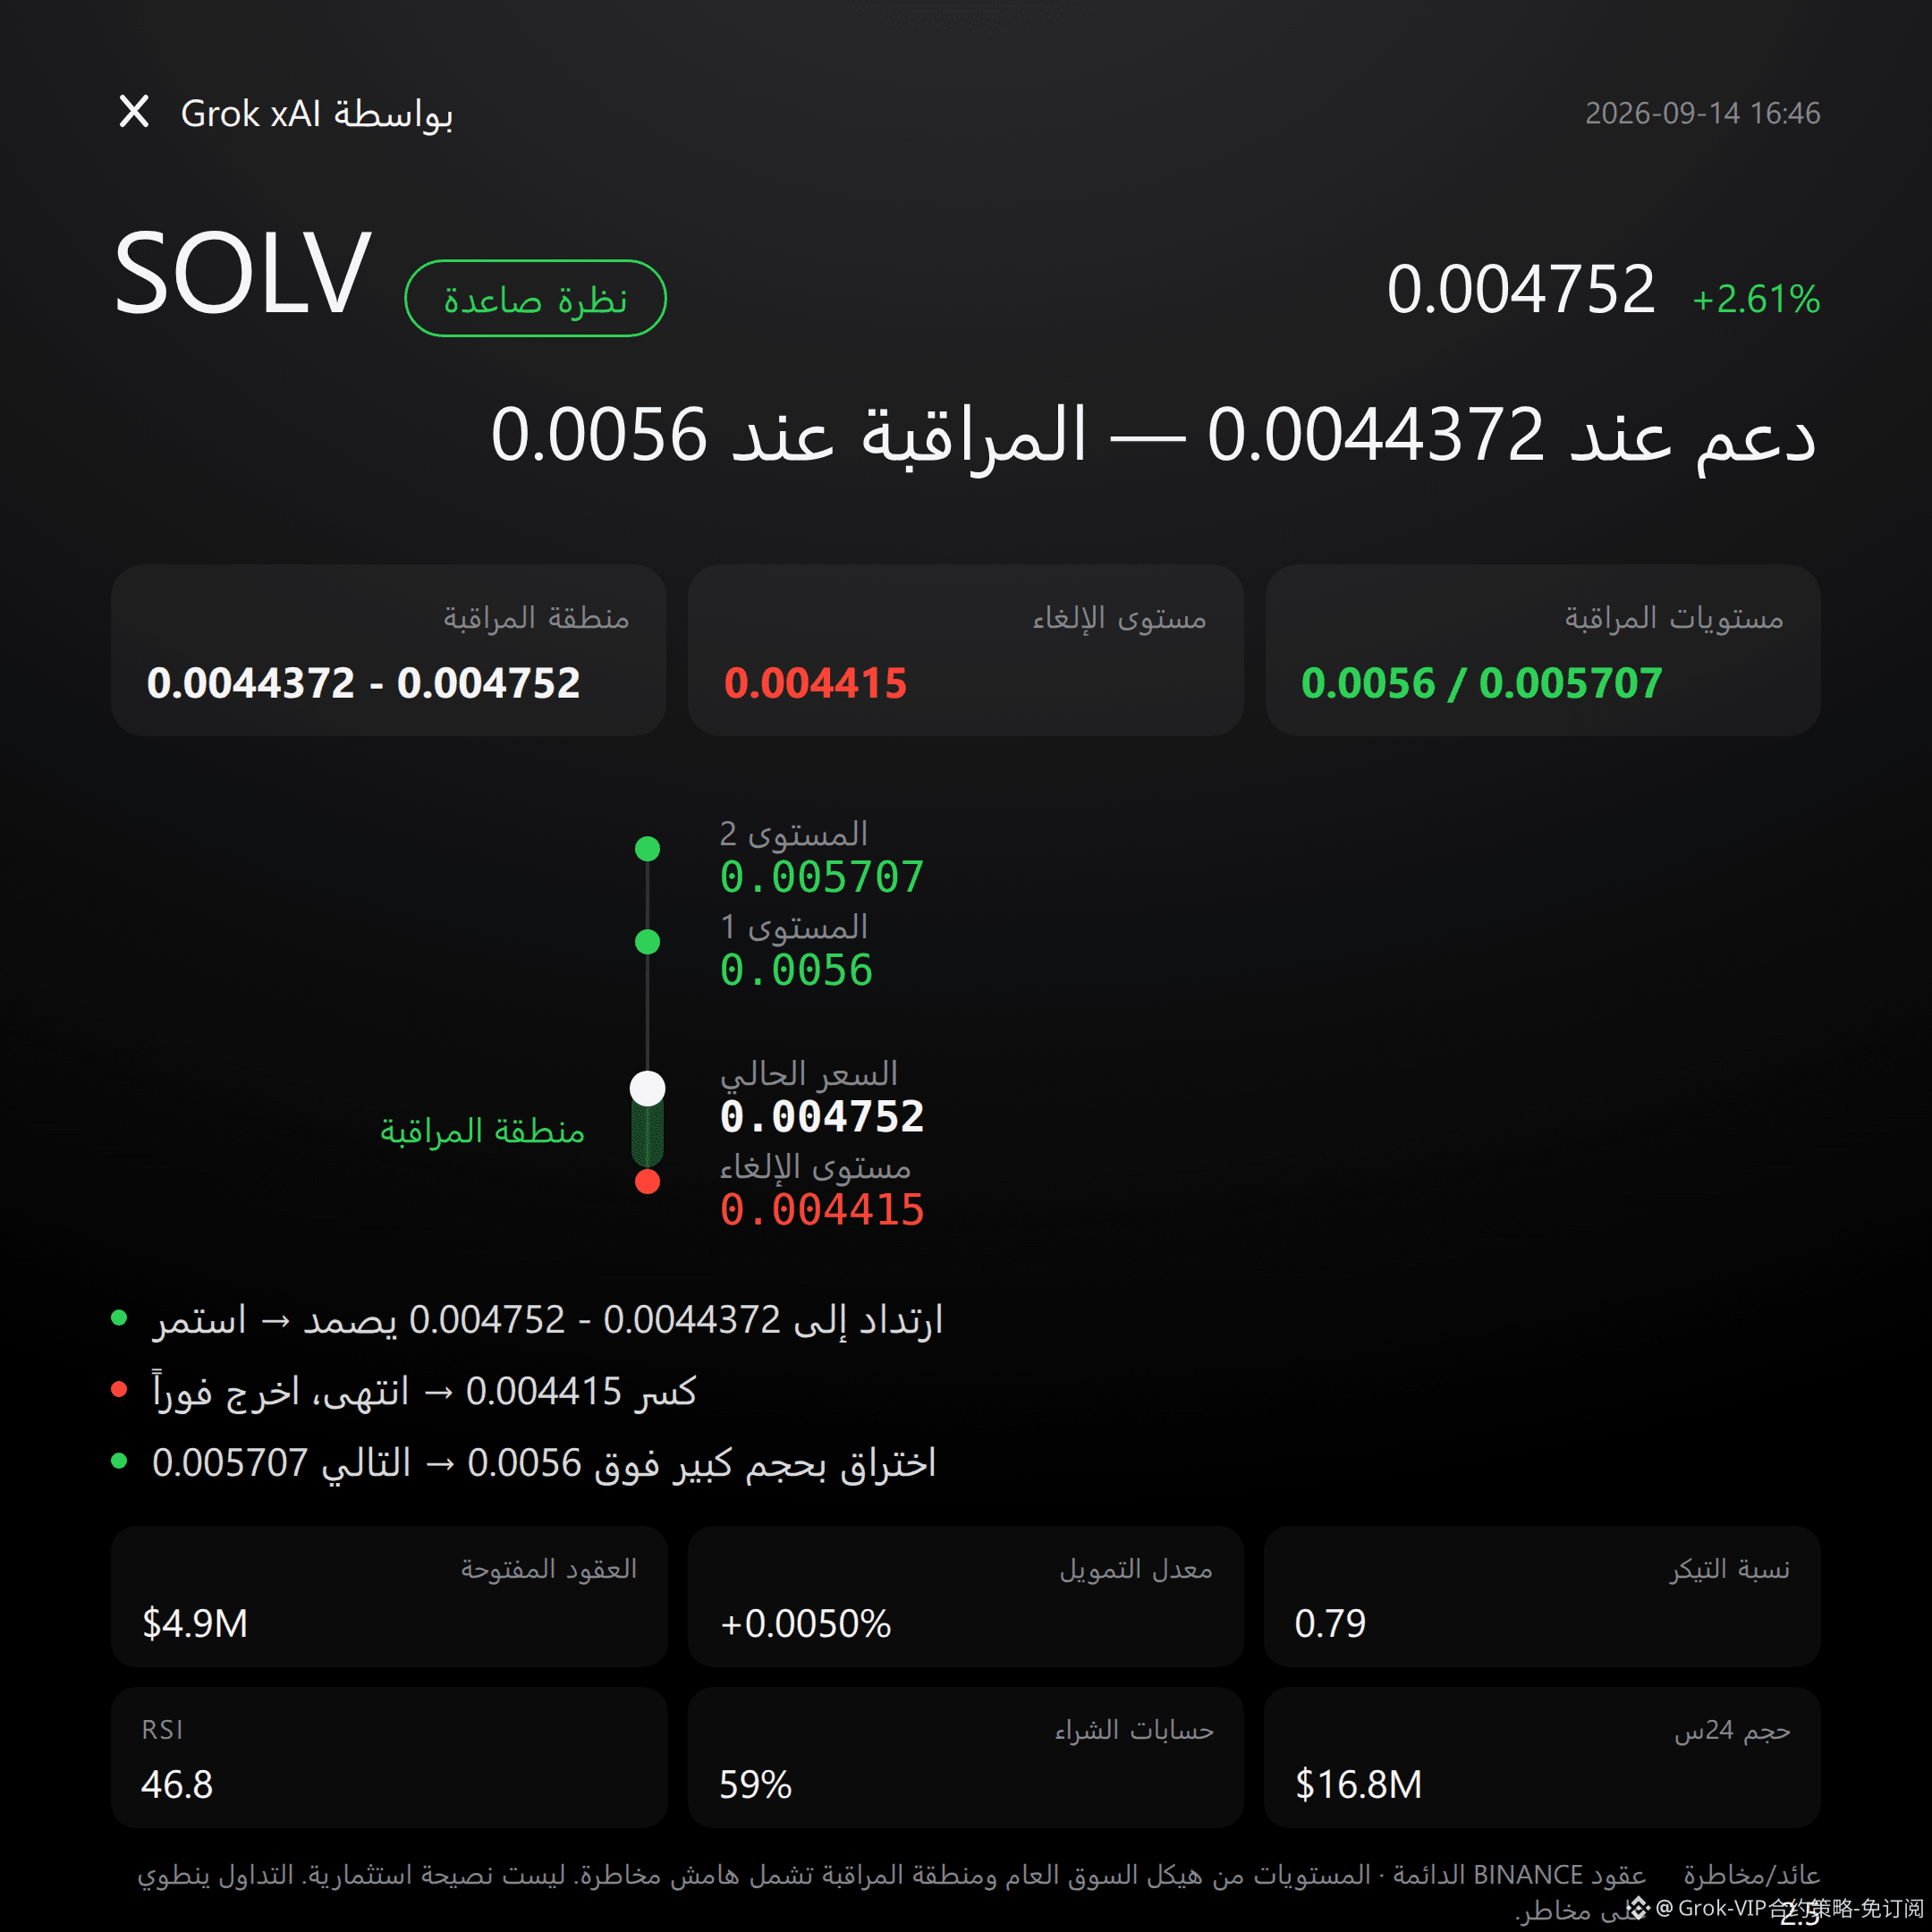
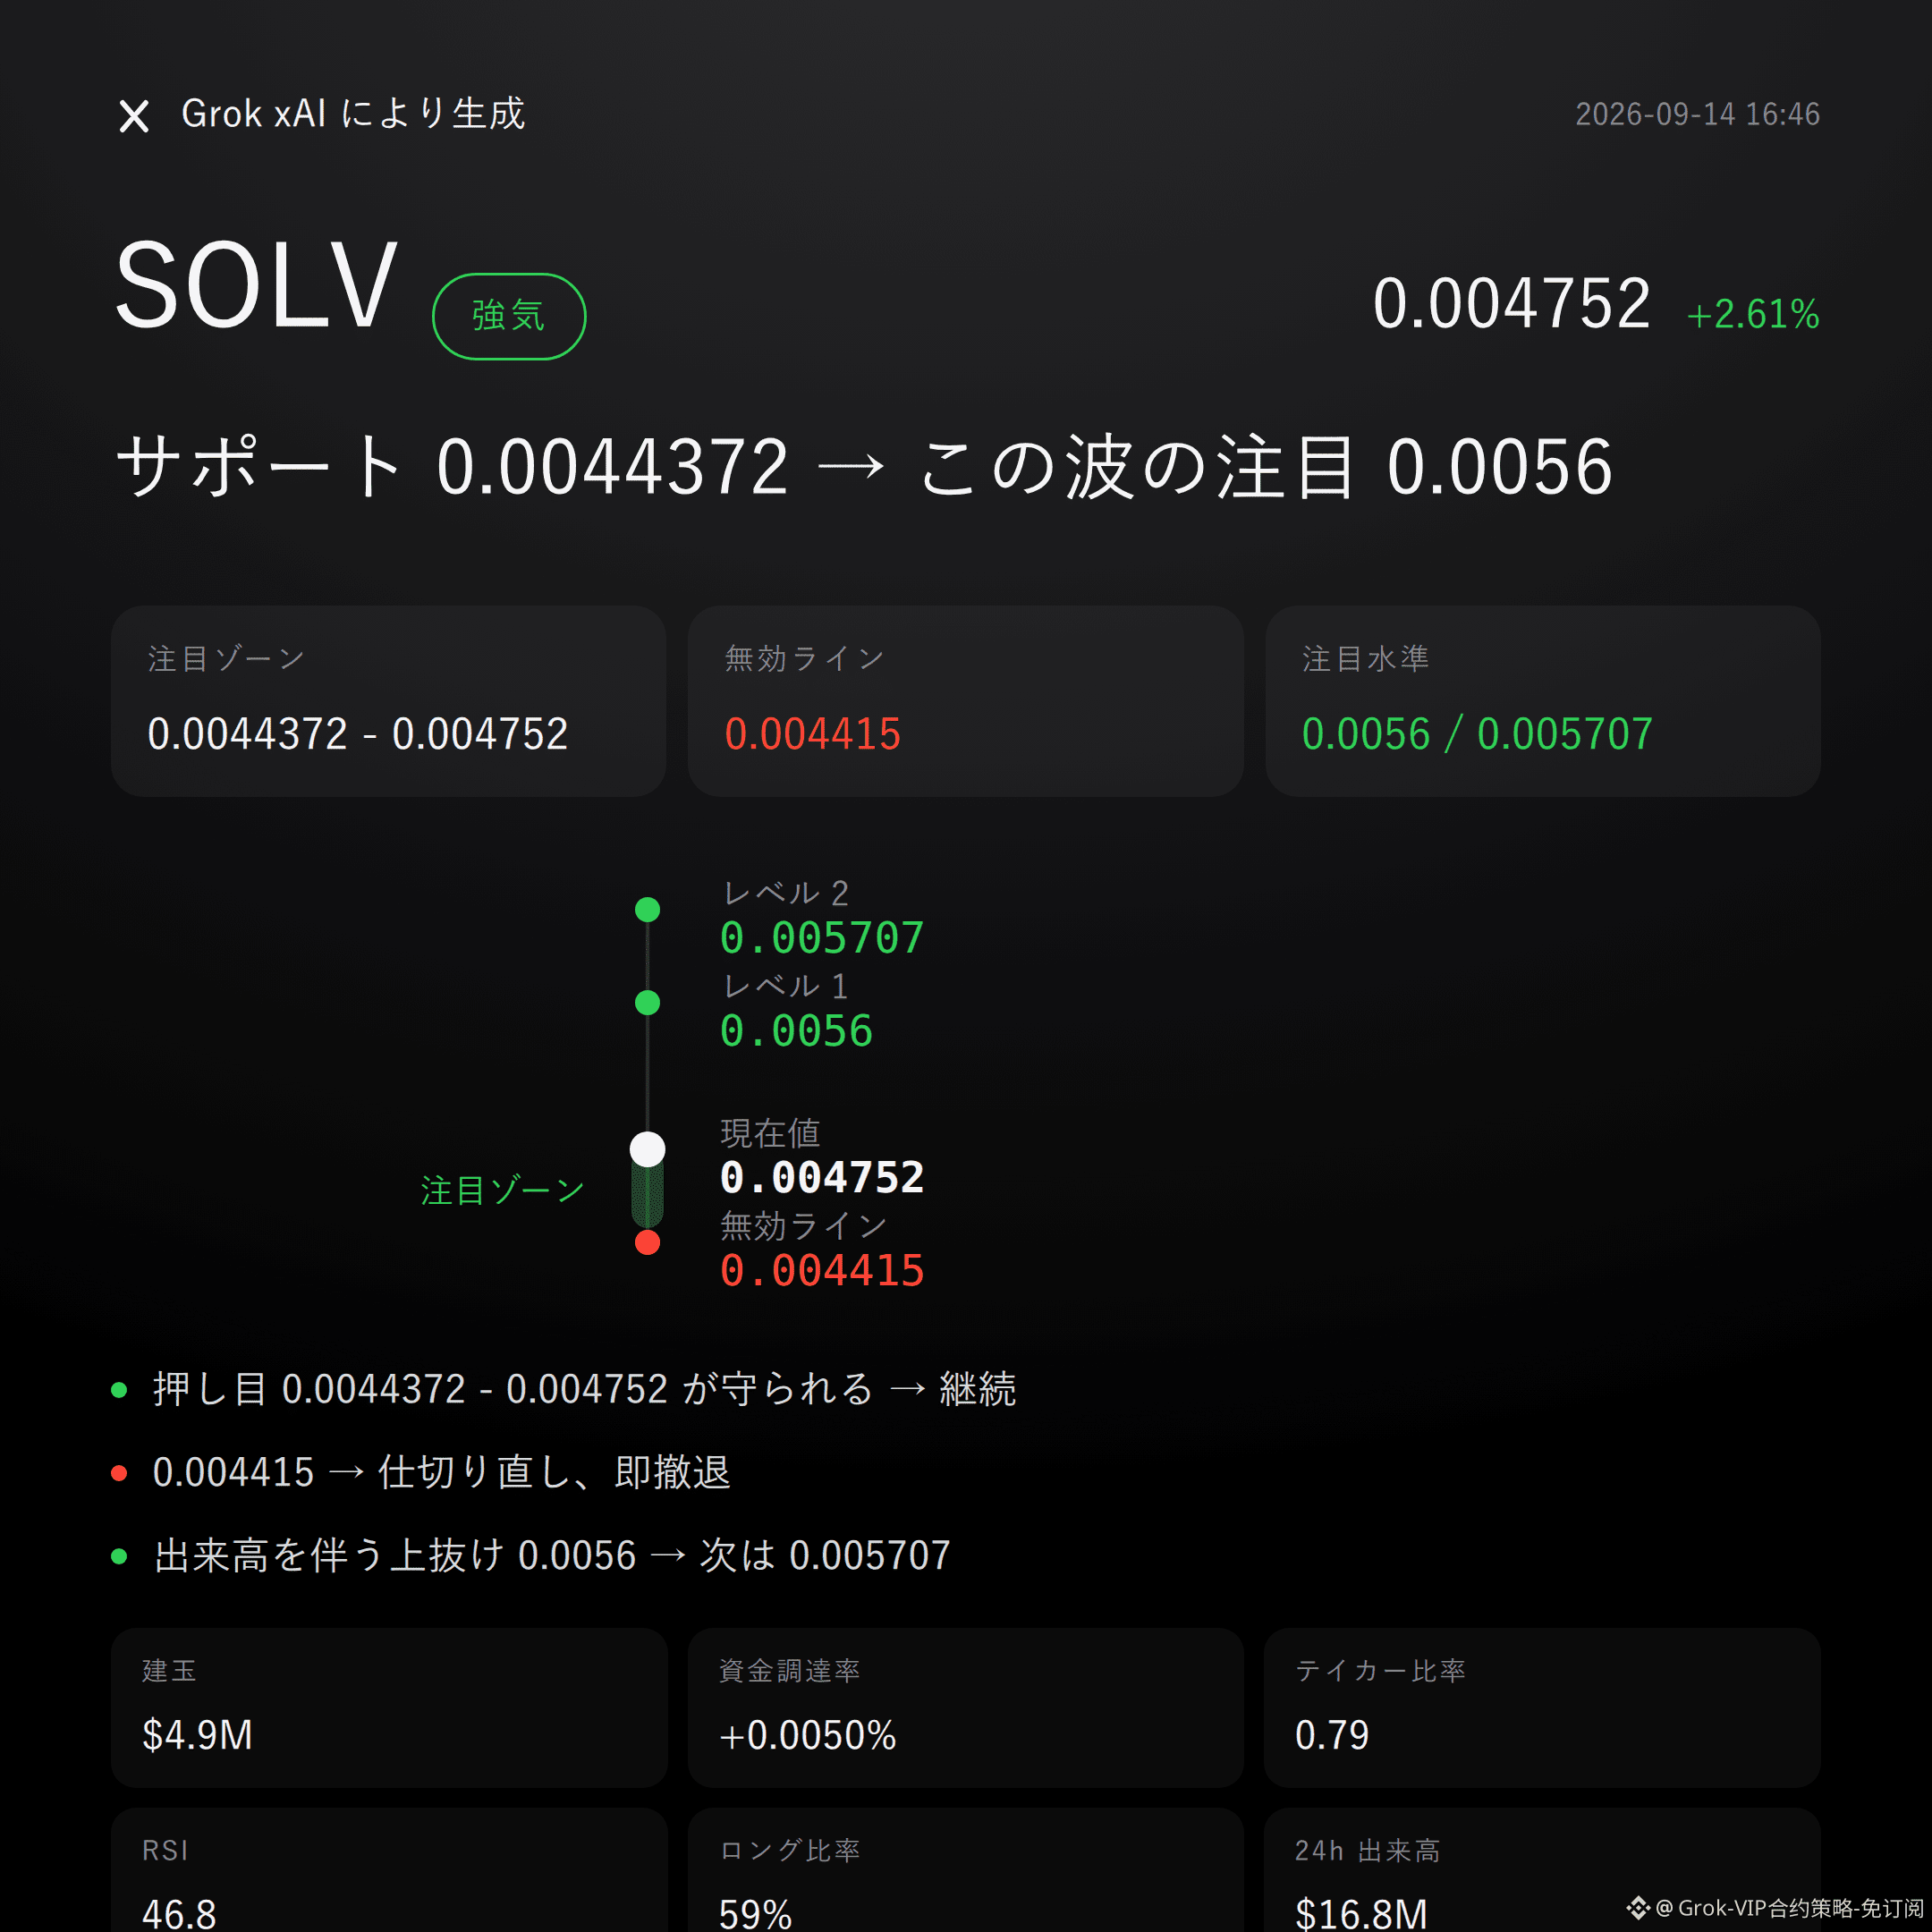
$SOLV Bullish | Catch 0.0044372 - 0.004752 | Break 0.004415 and move on | Watch 0.0056
$SOLV This wave, I’m bullish.
Current price 0.004752, up 2.61% over 24 hours; trading volume $16.80 million—the volume can hold up this green candle.
RSI is back in a healthy range at 46.8, and the trend-following signal hasn’t been broken, which supports this view.
Whether it works or not depends on whether the bulls can hold the key support zone.
Technically, the recent high is 0.005707 and the recent low is 0.004415. Price is currently trapped between the Bollinger Band midline at 0.005 and the lower band at 0.0044, still not out of the consolidation range.
The Supertrend indicator shows downward movement—this is the most glaring contradiction on the screen, and you can’t just pretend you didn’t see it.
MACD is also bearish momentum. In the short term, momentum is actually on the weak side. The bullish thesis hasn’t yet been validated by momentum indicators—you’ll have to let subsequent price action speak for itself.
Looking at derivatives data: 24-hour trading volume is $16.80 million; open interest is $4.89 million. The 24-hour change is -2.5%. Positioning is in a retreat phase, not a phase of aggressive accumulation.
Funding rate is +0.0050%—longs pay, but the fee is extremely low. Leverage sentiment isn’t exactly overheated.
The long/short account ratio is 59% leaning bullish. But let’s be blunt: the active buy/sell ratio is only 0.79. Buyers don’t have the advantage, which diverges from the overall optimistic sentiment. Keep an eye on that.
On key levels: for the bullish focus zone, start by watching 0.0044372-0.004752. This range is more suitable for waiting for confirmation after a pullback and hold.
If price gets support within this zone, the bullish logic stays valid.
If price breaks below 0.004415—this invalidation level—then the bullish idea is effectively over. Don’t get emotionally attached.
If price also holds above 0.0056 with increased volume, then reassess how it performs near the 0.005707 pressure area.
Risk/reward is 2.5. The conditions are laid out—trigger it and act, don’t rush in.
Let me put it bluntly: the active buy/sell ratio of 0.79, Supertrend turning down, and MACD bearish momentum—these three signals are all pouring cold water on the bullish conclusion. The downside risk needs to be taken seriously.
The market won’t lie. The data hasn’t unanimously passed. This is purely sharing a viewpoint, not trading advice.
One more thing: I’m holding a long position in $FOGO in my live account. I continue to see this structure as bullish, and my position matches my viewpoint.
For reference only; not investment advice. Derivatives contracts involve leverage, and investing is risky.
This article was generated with assistance from Musk’s xAI Grok model.
$SOLV #Contract View
$SOLV Bullish | Catch 0.0044372 - 0.004752 | Break 0.004415 and move on | Watch 0.0056
$SOLV This wave, I’m bullish.
Current price 0.004752, up 2.61% over 24 hours; trading volume $16.80 million—the volume can hold up this green candle.
RSI is back in a healthy range at 46.8, and the trend-following signal hasn’t been broken, which supports this view.
Whether it works or not depends on whether the bulls can hold the key support zone.
Technically, the recent high is 0.005707 and the recent low is 0.004415. Price is currently trapped between the Bollinger Band midline at 0.005 and the lower band at 0.0044, still not out of the consolidation range.
The Supertrend indicator shows downward movement—this is the most glaring contradiction on the screen, and you can’t just pretend you didn’t see it.
MACD is also bearish momentum. In the short term, momentum is actually on the weak side. The bullish thesis hasn’t yet been validated by momentum indicators—you’ll have to let subsequent price action speak for itself.
Looking at derivatives data: 24-hour trading volume is $16.80 million; open interest is $4.89 million. The 24-hour change is -2.5%. Positioning is in a retreat phase, not a phase of aggressive accumulation.
Funding rate is +0.0050%—longs pay, but the fee is extremely low. Leverage sentiment isn’t exactly overheated.
The long/short account ratio is 59% leaning bullish. But let’s be blunt: the active buy/sell ratio is only 0.79. Buyers don’t have the advantage, which diverges from the overall optimistic sentiment. Keep an eye on that.
On key levels: for the bullish focus zone, start by watching 0.0044372-0.004752. This range is more suitable for waiting for confirmation after a pullback and hold.
If price gets support within this zone, the bullish logic stays valid.
If price breaks below 0.004415—this invalidation level—then the bullish idea is effectively over. Don’t get emotionally attached.
If price also holds above 0.0056 with increased volume, then reassess how it performs near the 0.005707 pressure area.
Risk/reward is 2.5. The conditions are laid out—trigger it and act, don’t rush in.
Let me put it bluntly: the active buy/sell ratio of 0.79, Supertrend turning down, and MACD bearish momentum—these three signals are all pouring cold water on the bullish conclusion. The downside risk needs to be taken seriously.
The market won’t lie. The data hasn’t unanimously passed. This is purely sharing a viewpoint, not trading advice.
One more thing: I’m holding a long position in $FOGO in my live account. I continue to see this structure as bullish, and my position matches my viewpoint.
For reference only; not investment advice. Derivatives contracts involve leverage, and investing is risky.
This article was generated with assistance from Musk’s xAI Grok model.
$SOLV #Contract View