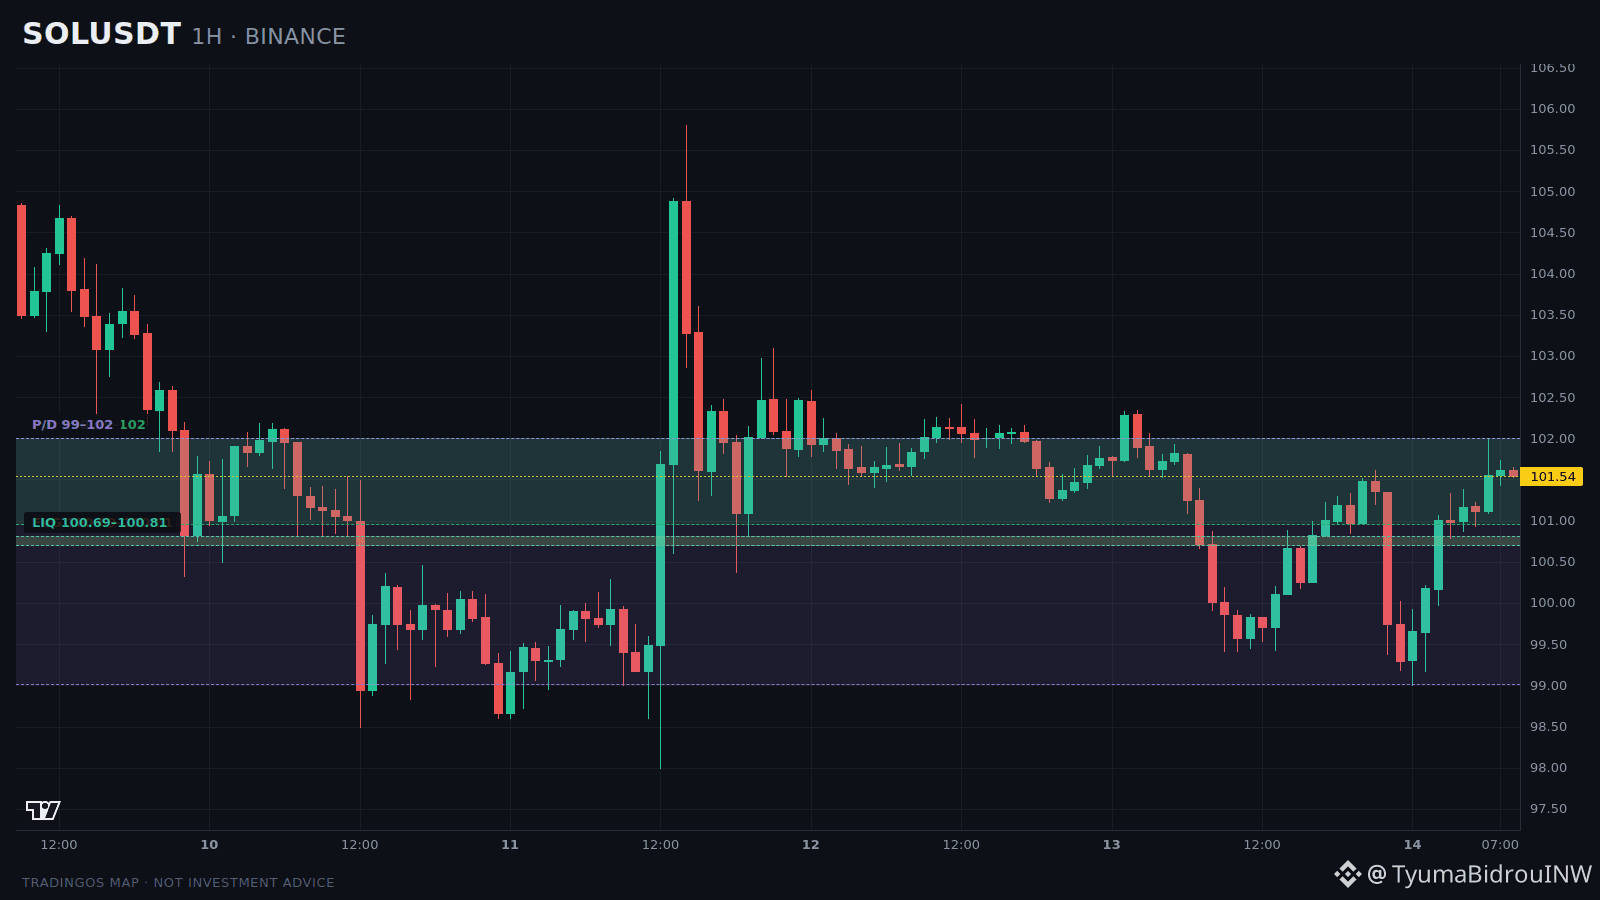
The crowd already has an opinion about $SOL — the chart has a question: the zone below the current price.
Price is about 101.64, +0.923% per day.
Daily range: 99–102.
What you can see on TradingOS:
— the price is inside the POI zone 100.95–102 — the current reaction zone;
— below the current price there is a bearish FVG 100.02–101.2 — a reaction zone below the price;
— below the current price there is a bullish FVG 100.69–100.81 — a reaction zone below the price;
— below the current price there is a bearish OB zone 100.11–100.89 — a reaction zone below the price;
Weight of scenarios based on current data:
long scenario — 25%;
short scenario — 62%.
This is not the probability of a trade, but an assessment of the context.
What’s important:
if the price returns above the 100.95–102 area and holds there, the long context will start strengthening. If the reaction is again weak, the bearish scenario will remain the main one.
This is a map of scenarios, not a trading instruction.
$SOL #Crypto #BinanceSquare #Trading
Chart and order book — click on $SOL .
Not investment advice.
Do you agree with the analysis or see it differently? I’m waiting for your take below.
Real-time breakdowns and a full log — on X: @TyumaBidrouINW
Price is about 101.64, +0.923% per day.
Daily range: 99–102.
What you can see on TradingOS:
— the price is inside the POI zone 100.95–102 — the current reaction zone;
— below the current price there is a bearish FVG 100.02–101.2 — a reaction zone below the price;
— below the current price there is a bullish FVG 100.69–100.81 — a reaction zone below the price;
— below the current price there is a bearish OB zone 100.11–100.89 — a reaction zone below the price;
Weight of scenarios based on current data:
long scenario — 25%;
short scenario — 62%.
This is not the probability of a trade, but an assessment of the context.
What’s important:
if the price returns above the 100.95–102 area and holds there, the long context will start strengthening. If the reaction is again weak, the bearish scenario will remain the main one.
This is a map of scenarios, not a trading instruction.
$SOL #Crypto #BinanceSquare #Trading
Chart and order book — click on $SOL .
Not investment advice.
Do you agree with the analysis or see it differently? I’m waiting for your take below.
Real-time breakdowns and a full log — on X: @TyumaBidrouINW