#ETH
#每日科普小知识
and add the key points
What is a W bottom? Let me explain it to you clearly with this ETH move
What does a W bottom look like?
Two bottoms, with a high point in between, connected to form a “W”.
ETH is now:
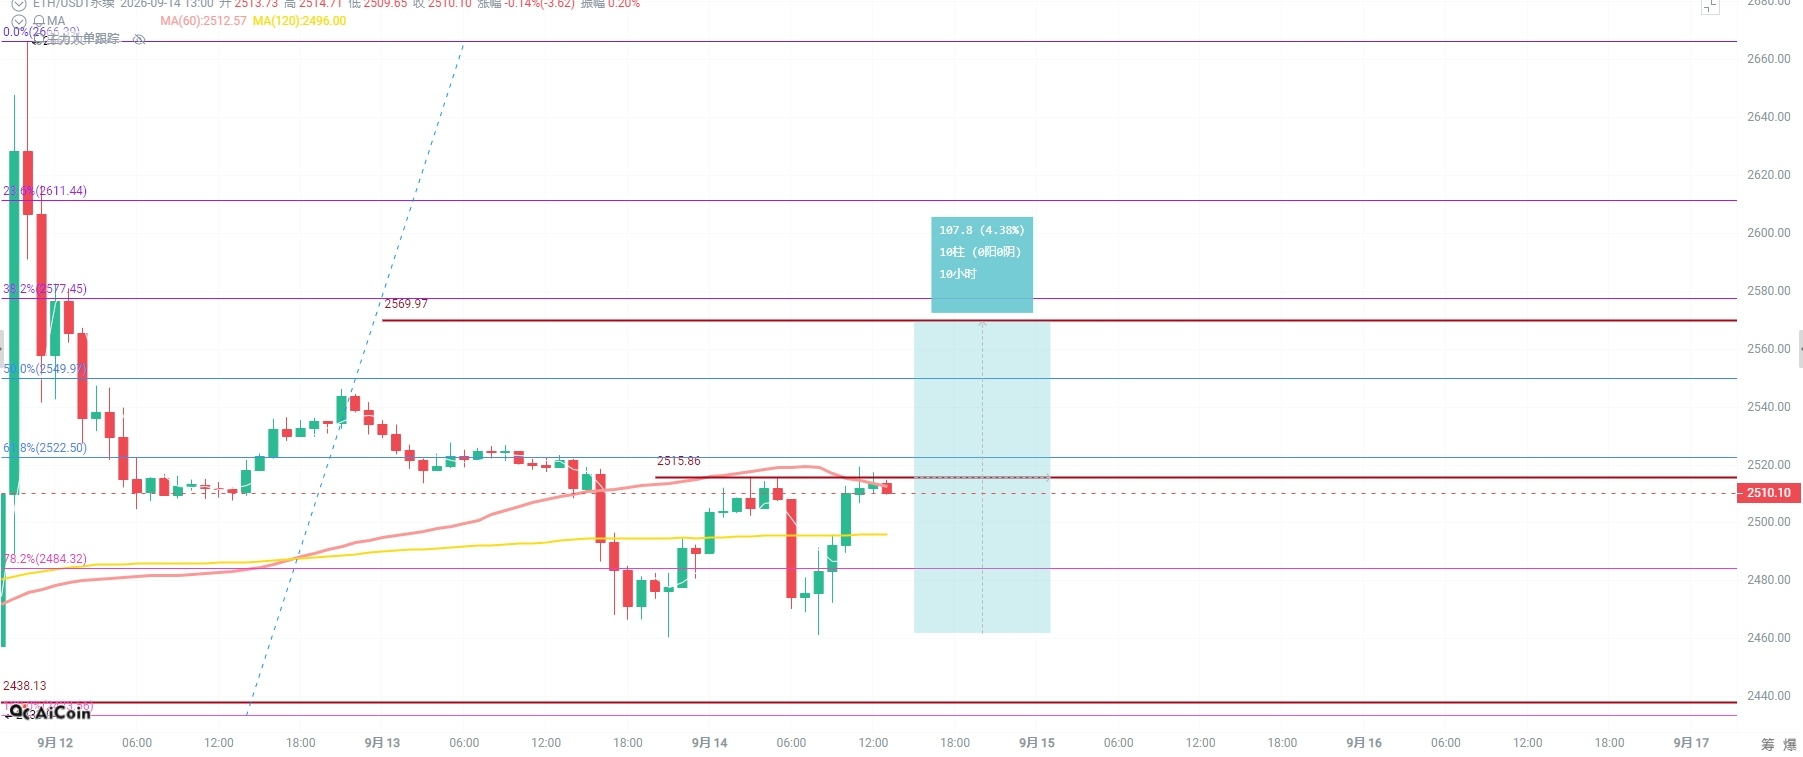
- Left bottom: 2460.3
- Right bottom: 2461.1
- Middle high point (neckline): 2515
The two bottoms differ by 0.8 points—almost perfectly level.
Why does the W bottom work?
What do the two bottoms indicate? At this level, people are stepping in.
The first time price fell to 2460, someone bought and it bounced up.
The second time it dropped to 2461, someone else bought again and it bounced up again.
Both times held—this means the 2460 support isn’t accidental. There is capital defending this level.
How to calculate the W bottom target?
Formula: neckline − lowest point = height; after breaking out, move the same height
ETH’s W bottom:
- Neckline: 2515; left bottom: 2460.3
- Height = 2515 − 2460.3 = 54.7 points
- Target after breaking the neckline = 2515 + 54.7 = 2570
This is the measured move—the standard calculation for a W bottom.
When does a W bottom become valid?
Three conditions:
1. Two bottoms—already formed: 2460.3 and 2461.1
2. Break of the neckline—must hold above 2515, not just a brief touch and fall back
3. No failure on the retest—after the breakout, retesting the neckline must not drop back
All three must be met; only then is the W bottom truly valid.
When does a W bottom fail?
Two scenarios:
1. Break below the lowest point of the two bottoms
2460.3 is the lower of the two bottoms. If price breaks below 2460, it means the levels that held twice can’t hold anymore—the W bottom is fake.
2. Can’t break through the neckline
If it reaches around 2515 and then drops repeatedly without breaking through, it means the neckline resistance is too heavy and the W bottom pattern can’t play out.
Key reminder
A W bottom is based on the 1-hour timeframe, not the weekly timeframe.
On smaller timeframes, even if it breaks out, it’s only a rebound, not a full reversal. The weekly trend is still a pullback; after the rebound, it should still fall.
In one sentence: the W bottom is based on 2460 holding twice, and the neckline break at 2515 targets 2570. But if 2460 breaks, don’t talk about a W bottom. Don’t mistake a small-timeframe rebound for a major行情. Short 2
Open short position at 2568
Add at 2582
Stop loss 2605
Take profit 2536-2507-2483-2462-2443-2412
#每日科普小知识
and add the key points
What is a W bottom? Let me explain it to you clearly with this ETH move
What does a W bottom look like?
Two bottoms, with a high point in between, connected to form a “W”.
ETH is now:
- Left bottom: 2460.3
- Right bottom: 2461.1
- Middle high point (neckline): 2515
The two bottoms differ by 0.8 points—almost perfectly level.
Why does the W bottom work?
What do the two bottoms indicate? At this level, people are stepping in.
The first time price fell to 2460, someone bought and it bounced up.
The second time it dropped to 2461, someone else bought again and it bounced up again.
Both times held—this means the 2460 support isn’t accidental. There is capital defending this level.
How to calculate the W bottom target?
Formula: neckline − lowest point = height; after breaking out, move the same height
ETH’s W bottom:
- Neckline: 2515; left bottom: 2460.3
- Height = 2515 − 2460.3 = 54.7 points
- Target after breaking the neckline = 2515 + 54.7 = 2570
This is the measured move—the standard calculation for a W bottom.
When does a W bottom become valid?
Three conditions:
1. Two bottoms—already formed: 2460.3 and 2461.1
2. Break of the neckline—must hold above 2515, not just a brief touch and fall back
3. No failure on the retest—after the breakout, retesting the neckline must not drop back
All three must be met; only then is the W bottom truly valid.
When does a W bottom fail?
Two scenarios:
1. Break below the lowest point of the two bottoms
2460.3 is the lower of the two bottoms. If price breaks below 2460, it means the levels that held twice can’t hold anymore—the W bottom is fake.
2. Can’t break through the neckline
If it reaches around 2515 and then drops repeatedly without breaking through, it means the neckline resistance is too heavy and the W bottom pattern can’t play out.
Key reminder
A W bottom is based on the 1-hour timeframe, not the weekly timeframe.
On smaller timeframes, even if it breaks out, it’s only a rebound, not a full reversal. The weekly trend is still a pullback; after the rebound, it should still fall.
In one sentence: the W bottom is based on 2460 holding twice, and the neckline break at 2515 targets 2570. But if 2460 breaks, don’t talk about a W bottom. Don’t mistake a small-timeframe rebound for a major行情. Short 2
Open short position at 2568
Add at 2582
Stop loss 2605
Take profit 2536-2507-2483-2462-2443-2412