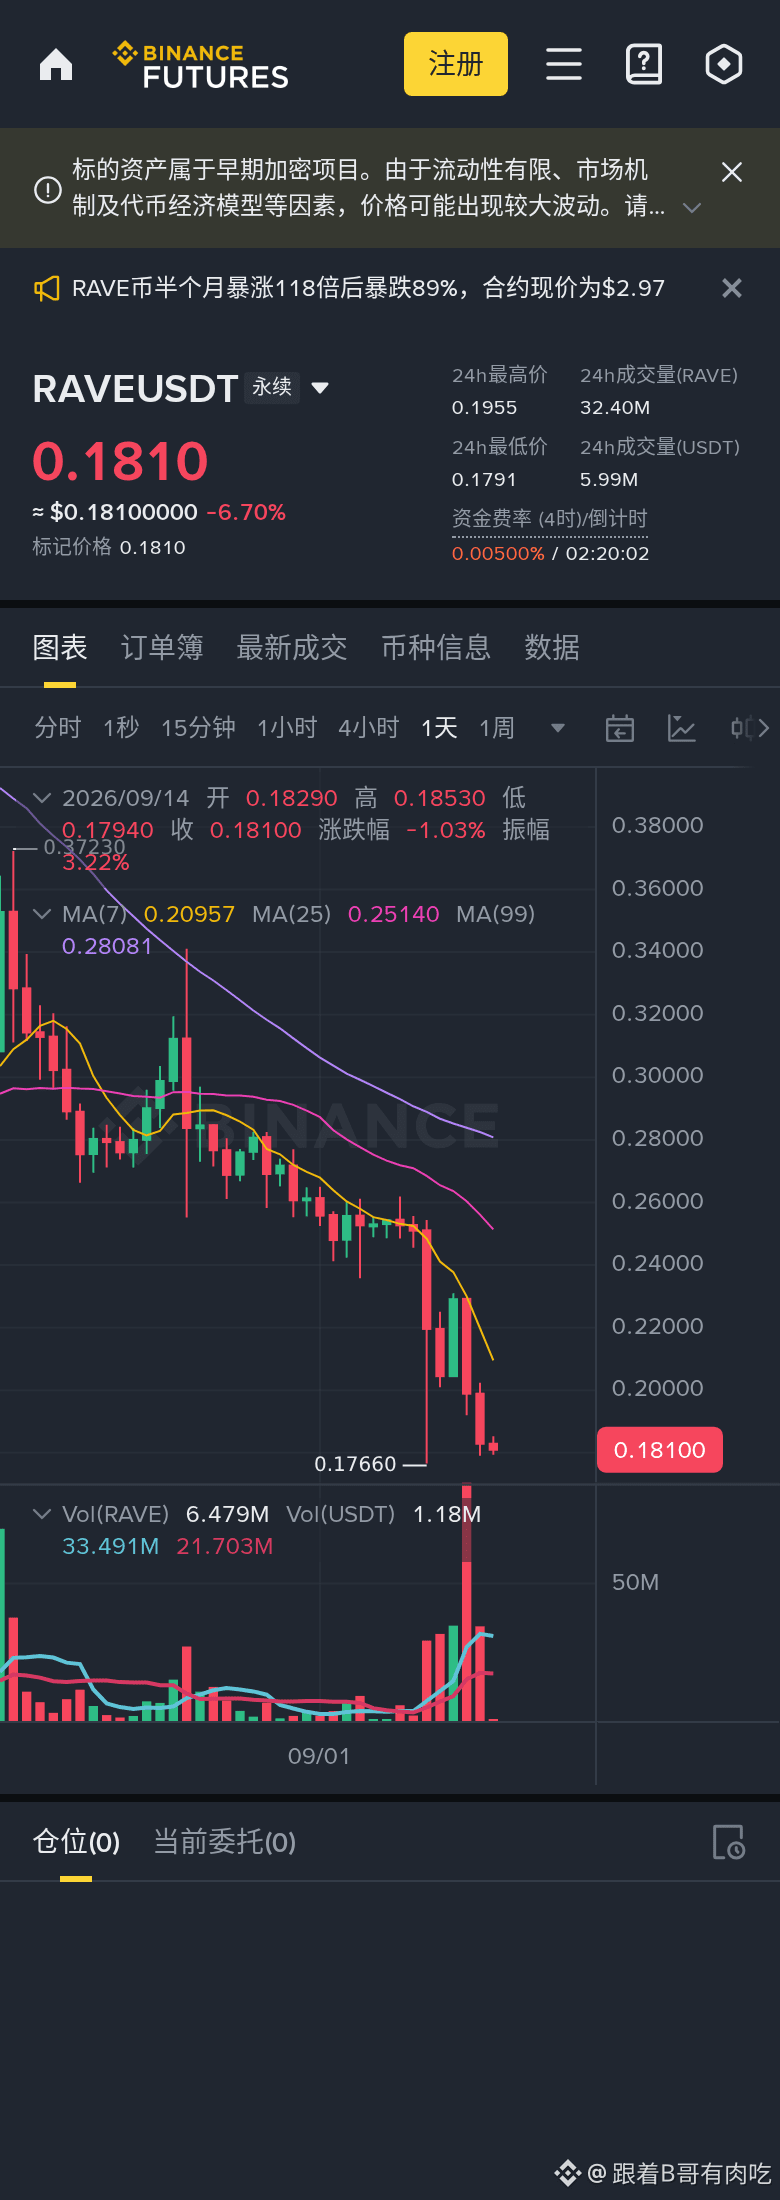
【RAVE·Weekly chart】bearish bias. Here’s how to read the key levels
Someone asked for an update on RAVE—so I’ll explain the weekly chart’s key levels in one go. Three crows are a persistent bearish signal, so treat any rebound as bearish. On the weekly chart: 0.1811 (-6.84%); RSI is 36.0. Moving average data is insufficient/ data insufficient. The candlesticks are three crows. First remember the levels: support at 0.1766, resistance at 28.3000 (weekly). If it breaks, we can talk about the direction.
Specific levels: reference entry at 0.1811, stop-loss at 0.1865, target at 0.1730, risk-reward ratio 1.5:1, position size 1–2%. The pattern is weakening, but the moving averages haven’t fully broken down yet—so treat it as a pullback for now. Consider shorting only if a rebound meets resistance and fails.
Reminder: don’t exceed 1–2% position size. If the stop-loss gets hit, exit—never average down. The levels will move with market price; before acting, re-check the chart yourself.
⚠️ Purely technical sharing, not investment advice. You’re responsible for the outcome. Crypto is highly volatile—judge independently and control your risk.
#RAVE #币安广场 #Oversold
Someone asked for an update on RAVE—so I’ll explain the weekly chart’s key levels in one go. Three crows are a persistent bearish signal, so treat any rebound as bearish. On the weekly chart: 0.1811 (-6.84%); RSI is 36.0. Moving average data is insufficient/ data insufficient. The candlesticks are three crows. First remember the levels: support at 0.1766, resistance at 28.3000 (weekly). If it breaks, we can talk about the direction.
Specific levels: reference entry at 0.1811, stop-loss at 0.1865, target at 0.1730, risk-reward ratio 1.5:1, position size 1–2%. The pattern is weakening, but the moving averages haven’t fully broken down yet—so treat it as a pullback for now. Consider shorting only if a rebound meets resistance and fails.
Reminder: don’t exceed 1–2% position size. If the stop-loss gets hit, exit—never average down. The levels will move with market price; before acting, re-check the chart yourself.
⚠️ Purely technical sharing, not investment advice. You’re responsible for the outcome. Crypto is highly volatile—judge independently and control your risk.
#RAVE #币安广场 #Oversold