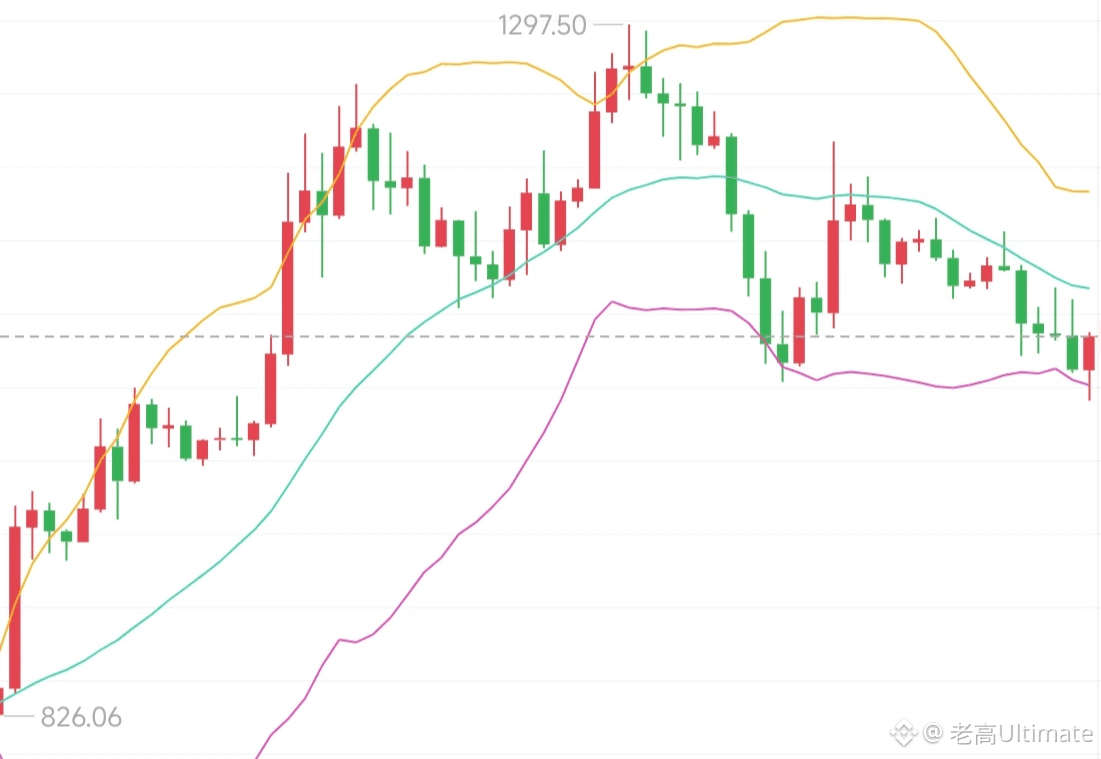
On the daily chart, during the early phase, the price rallied up to the 1297 high point and met resistance, then pulled back. The price has held above the Bollinger Middle Band at 994. The larger long-term bullish structure has not been fully broken yet. After a round of sharp advance, the upward momentum has clearly weakened; the Bollinger Bands have started to contract, and the market is entering a high-level pullback phase for digestion. Strong resistance is formed at 1180–1200, which is the key line dividing bulls and bears. It cannot regain a firm hold there, so the high-level pullback is likely to continue. On the downside, focus on the Bollinger Middle Band at 994 as the key support.
4-hour timeframe: After the rally to 1297, the recent highs keep making lower highs; the price is trading below the Bollinger Middle Band, and the Bollinger Bands are opening downward. Bearish momentum continues to release, and the short-term pullback trend is clear. The current rebound on the chart is a corrective bounce during the down move, not a trend reversal.
1-hour timeframe: After probing the low at 1041, the market showed a modest repair-and-rebound. The price is still capped below the Bollinger Middle Band, and the Bollinger Bands are contracting downward. There is some rebound-repair momentum in the short term, but its strength is limited; this is a technical counter-bounce within the broader pullback.
Overall approach:
The larger timeframe bullish structure is still intact, while the short term is in a high-level pullback stage. Trading should primarily focus on selling/shorting rallies. If the rebound reaches the 1120–1140 area, go short there, targeting 1060–1000. If price breaks below 1000, follow the move and look for 930#比特币四周内第三次单块重组 $ZEC .
4-hour timeframe: After the rally to 1297, the recent highs keep making lower highs; the price is trading below the Bollinger Middle Band, and the Bollinger Bands are opening downward. Bearish momentum continues to release, and the short-term pullback trend is clear. The current rebound on the chart is a corrective bounce during the down move, not a trend reversal.
1-hour timeframe: After probing the low at 1041, the market showed a modest repair-and-rebound. The price is still capped below the Bollinger Middle Band, and the Bollinger Bands are contracting downward. There is some rebound-repair momentum in the short term, but its strength is limited; this is a technical counter-bounce within the broader pullback.
Overall approach:
The larger timeframe bullish structure is still intact, while the short term is in a high-level pullback stage. Trading should primarily focus on selling/shorting rallies. If the rebound reaches the 1120–1140 area, go short there, targeting 1060–1000. If price breaks below 1000, follow the move and look for 930#比特币四周内第三次单块重组 $ZEC .