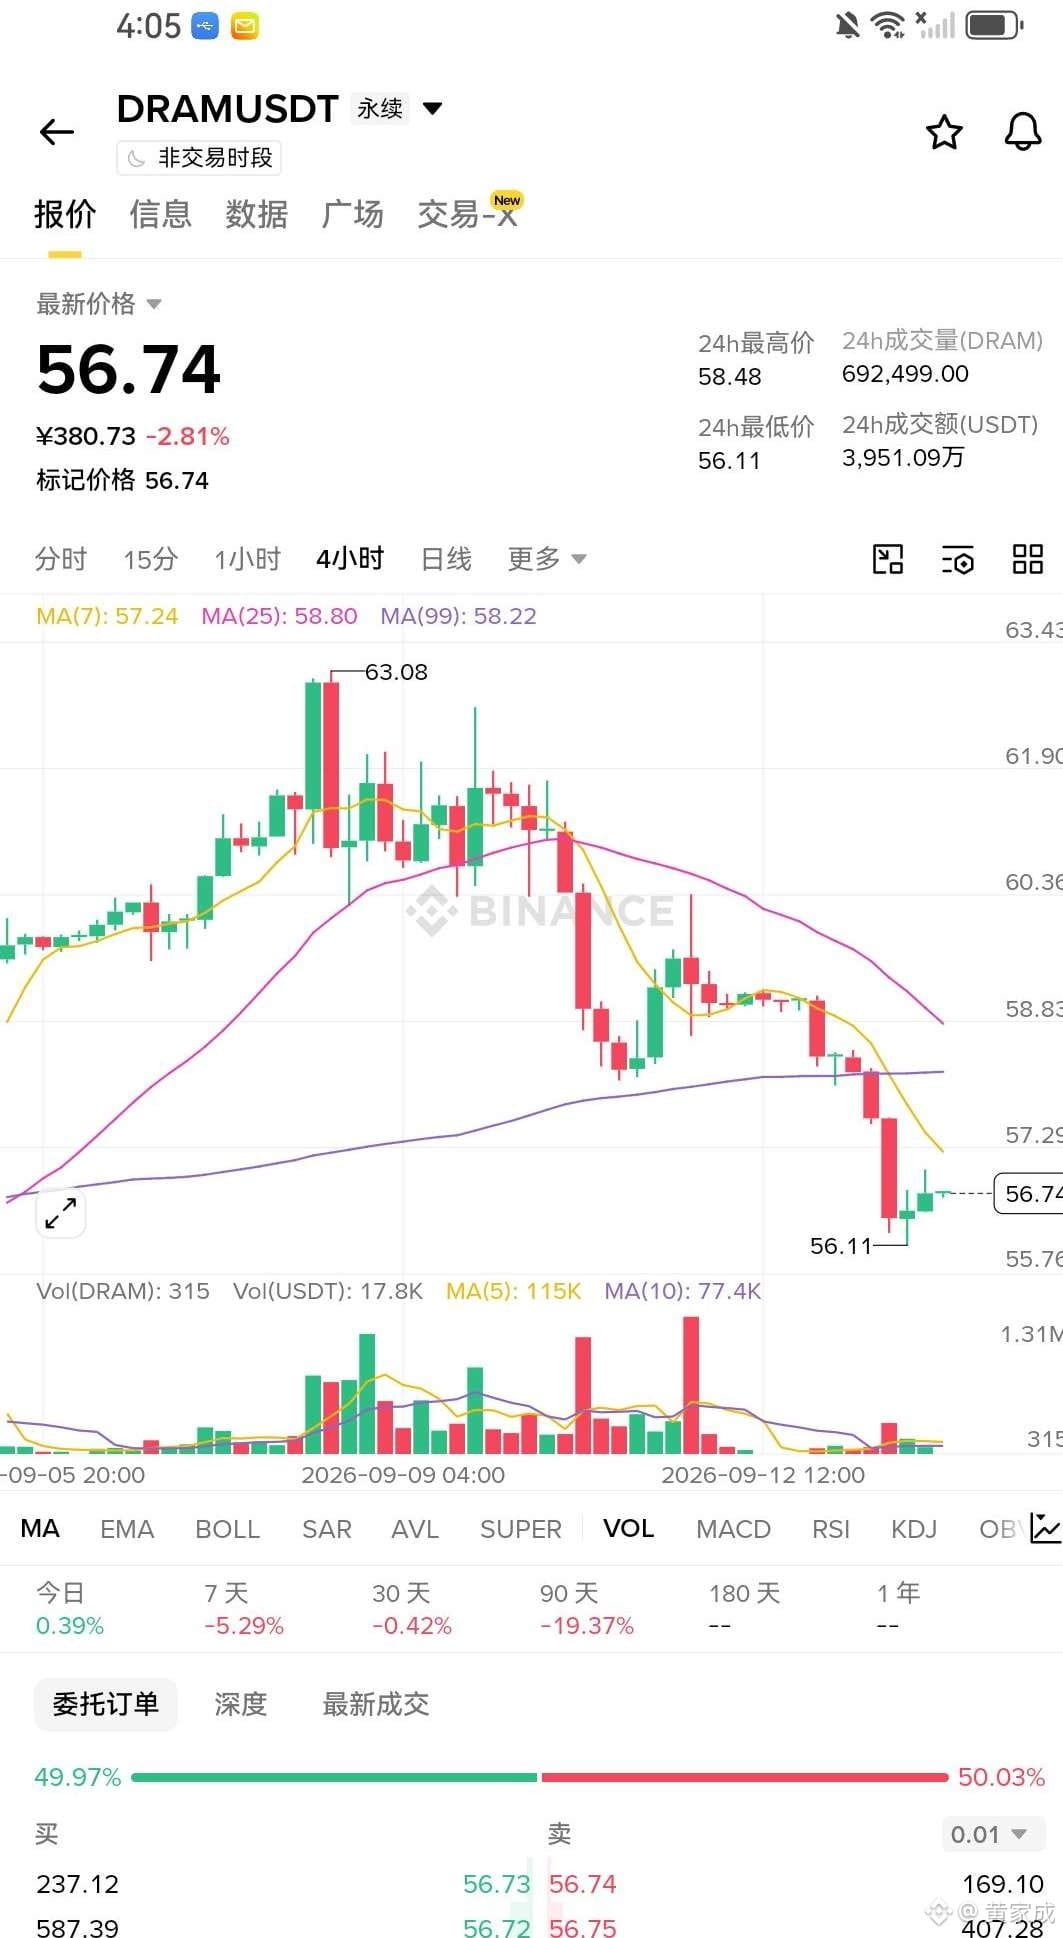
DRAM This chart is a textbook example of a bearish continuation. On the 15m timeframe, price is hovering and struggling just below the MA20. On the 4h timeframe, out of the six candles, four are bearish. During the rebound, it can’t even form a decent higher high. Short-term volume suddenly spikes by 159%, but price doesn’t rise and instead falls—this is a signal of accelerated bottoming attempts. Don’t be fooled into getting trapped by a few buy orders. Short at 56.8. First target is 54.2. If it breaks, look at 52.1. Stop loss at 59.2—if it reclaims that level, admit the mistake and exit. Don’t fight the trend.

Post

--
Disclaimer: Includes third-party opinions. No advice. Binance AI may be used without guarantee. See T&Cs.