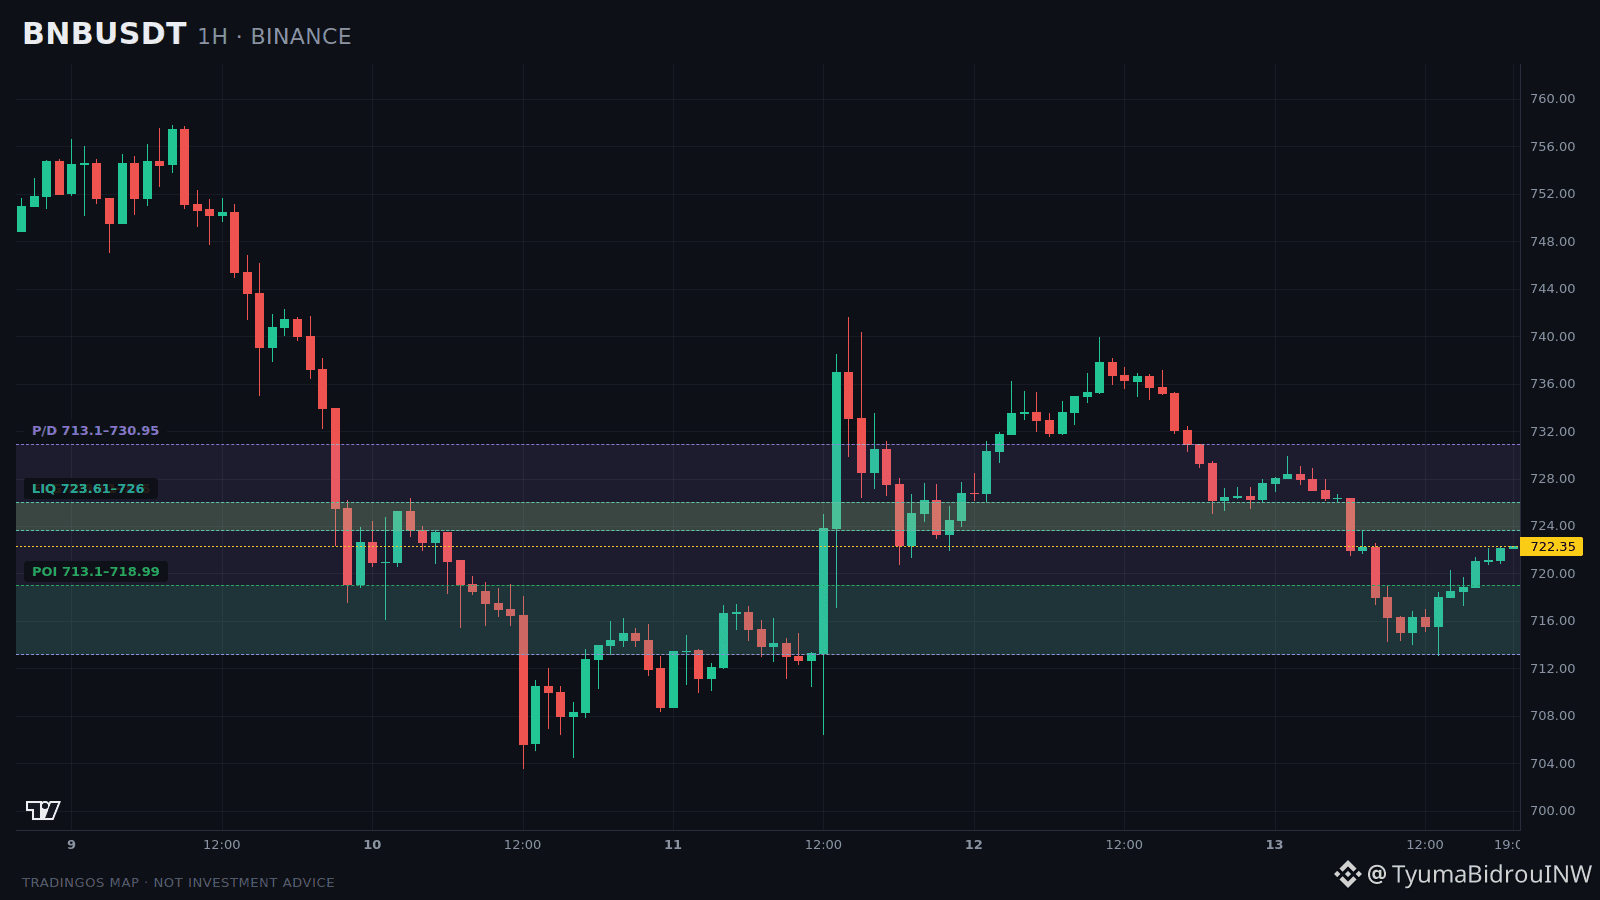
$BNB back in action — the reaction zone is above the current price; next, it’s up to the price.
Price is around 722.23, down -0.993% over the day.
Daily range: 713.1–729.92.
What you can see on TradingOS:
— below the current price there is a POI 713.1–718.987 — a reaction zone below the price;
— below the current price there is a bearish FVG 719–721.73 — a reaction zone below the price;
— above the current price there is a bearish FVG 723.61–726 — a pressure zone, not support, because price is currently below it;
— above the current price there is a bearish OB zone 724.41–727.66 — a pressure zone, not support, because price is currently below it;
Weight of scenarios based on current data:
long scenario — 50%;
short scenario — 39%.
This is not the probability of a trade, but an assessment of the context.
What matters:
if the price holds the reaction near the 723.61–726 area, the long context will retain the advantage. If the area is lost, the scenario will become weaker.
This is a scenario map, not a trading instruction.
$BNB #Crypto #BinanceSquare #Trading
Chart and order book — click on $BNB .
Not an investment recommendation.
Is this format useful? Let me know in the comments what to add.
Real-time breakdowns and full log — on X: @TyumaBidrouINW
Price is around 722.23, down -0.993% over the day.
Daily range: 713.1–729.92.
What you can see on TradingOS:
— below the current price there is a POI 713.1–718.987 — a reaction zone below the price;
— below the current price there is a bearish FVG 719–721.73 — a reaction zone below the price;
— above the current price there is a bearish FVG 723.61–726 — a pressure zone, not support, because price is currently below it;
— above the current price there is a bearish OB zone 724.41–727.66 — a pressure zone, not support, because price is currently below it;
Weight of scenarios based on current data:
long scenario — 50%;
short scenario — 39%.
This is not the probability of a trade, but an assessment of the context.
What matters:
if the price holds the reaction near the 723.61–726 area, the long context will retain the advantage. If the area is lost, the scenario will become weaker.
This is a scenario map, not a trading instruction.
$BNB #Crypto #BinanceSquare #Trading
Chart and order book — click on $BNB .
Not an investment recommendation.
Is this format useful? Let me know in the comments what to add.
Real-time breakdowns and full log — on X: @TyumaBidrouINW