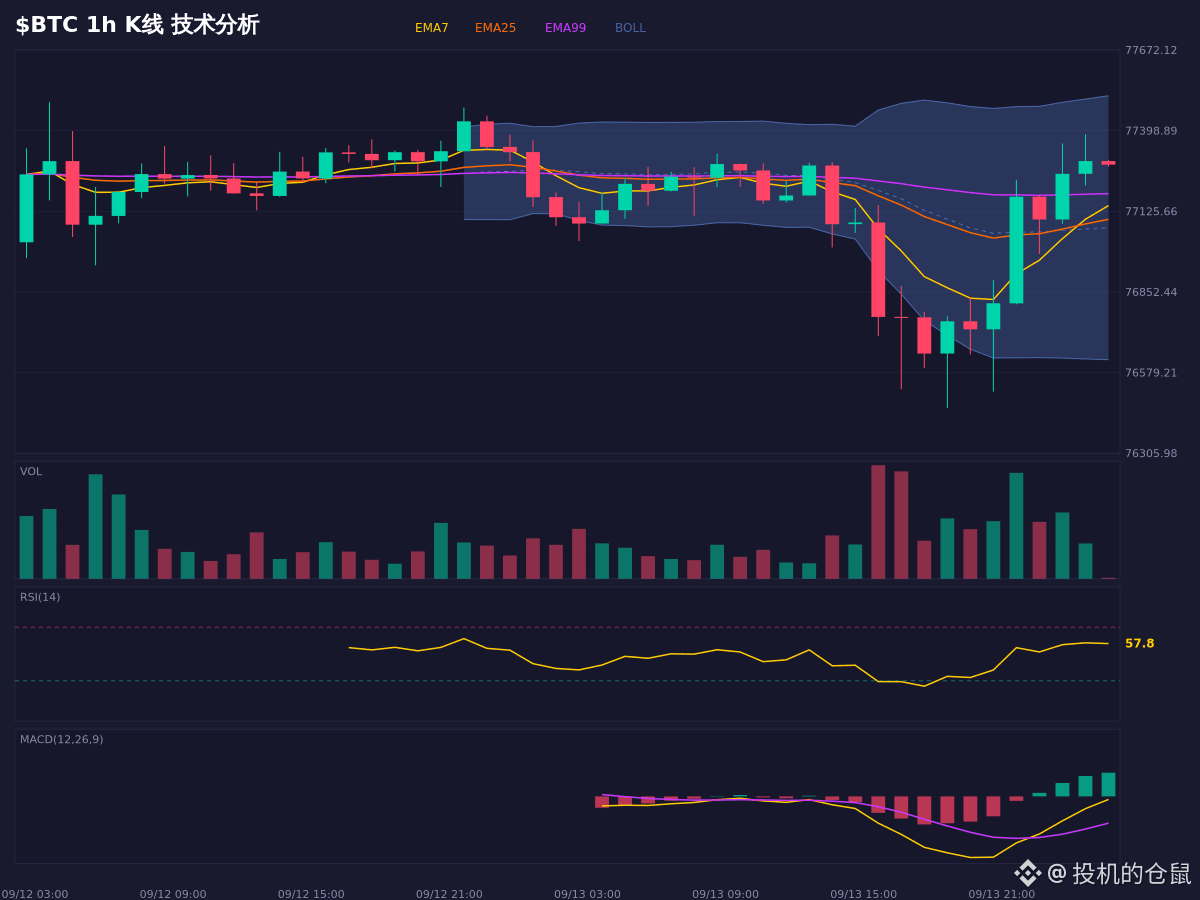
$BTC Daily line structure is net bullish, but there are conflicting signals on the short-term chart. On one hand, EMA7>EMA25 and the MACD histogram is expanding, which confirms that short-term bullish momentum is indeed present; on the other hand, the Stoch RSI on the 1H and 4H charts is both close to 100, indicating severe overbought conditions and a non-trivial pullback risk.
The current price is undergoing a narrow-range consolidation above the EMA25 (77102.83). If it can hold steady around 77000, the bullish structure may continue; but if it breaks below 76900, the short-term logic could fail.
This upward move is different from the earlier one: the funding rate is normal, and the long/short ratio is not extreme. That suggests retail sentiment is relatively rational—not the kind of totally crazy FOMO rally.
For chart observation and scenario planning only; it does not constitute a record of trading operations.
$BTC #现货 #交易 #Perpetual contract
The current price is undergoing a narrow-range consolidation above the EMA25 (77102.83). If it can hold steady around 77000, the bullish structure may continue; but if it breaks below 76900, the short-term logic could fail.
This upward move is different from the earlier one: the funding rate is normal, and the long/short ratio is not extreme. That suggests retail sentiment is relatively rational—not the kind of totally crazy FOMO rally.
For chart observation and scenario planning only; it does not constitute a record of trading operations.
$BTC #现货 #交易 #Perpetual contract