Grok Market Snapshot Commentary|9/14 01:46
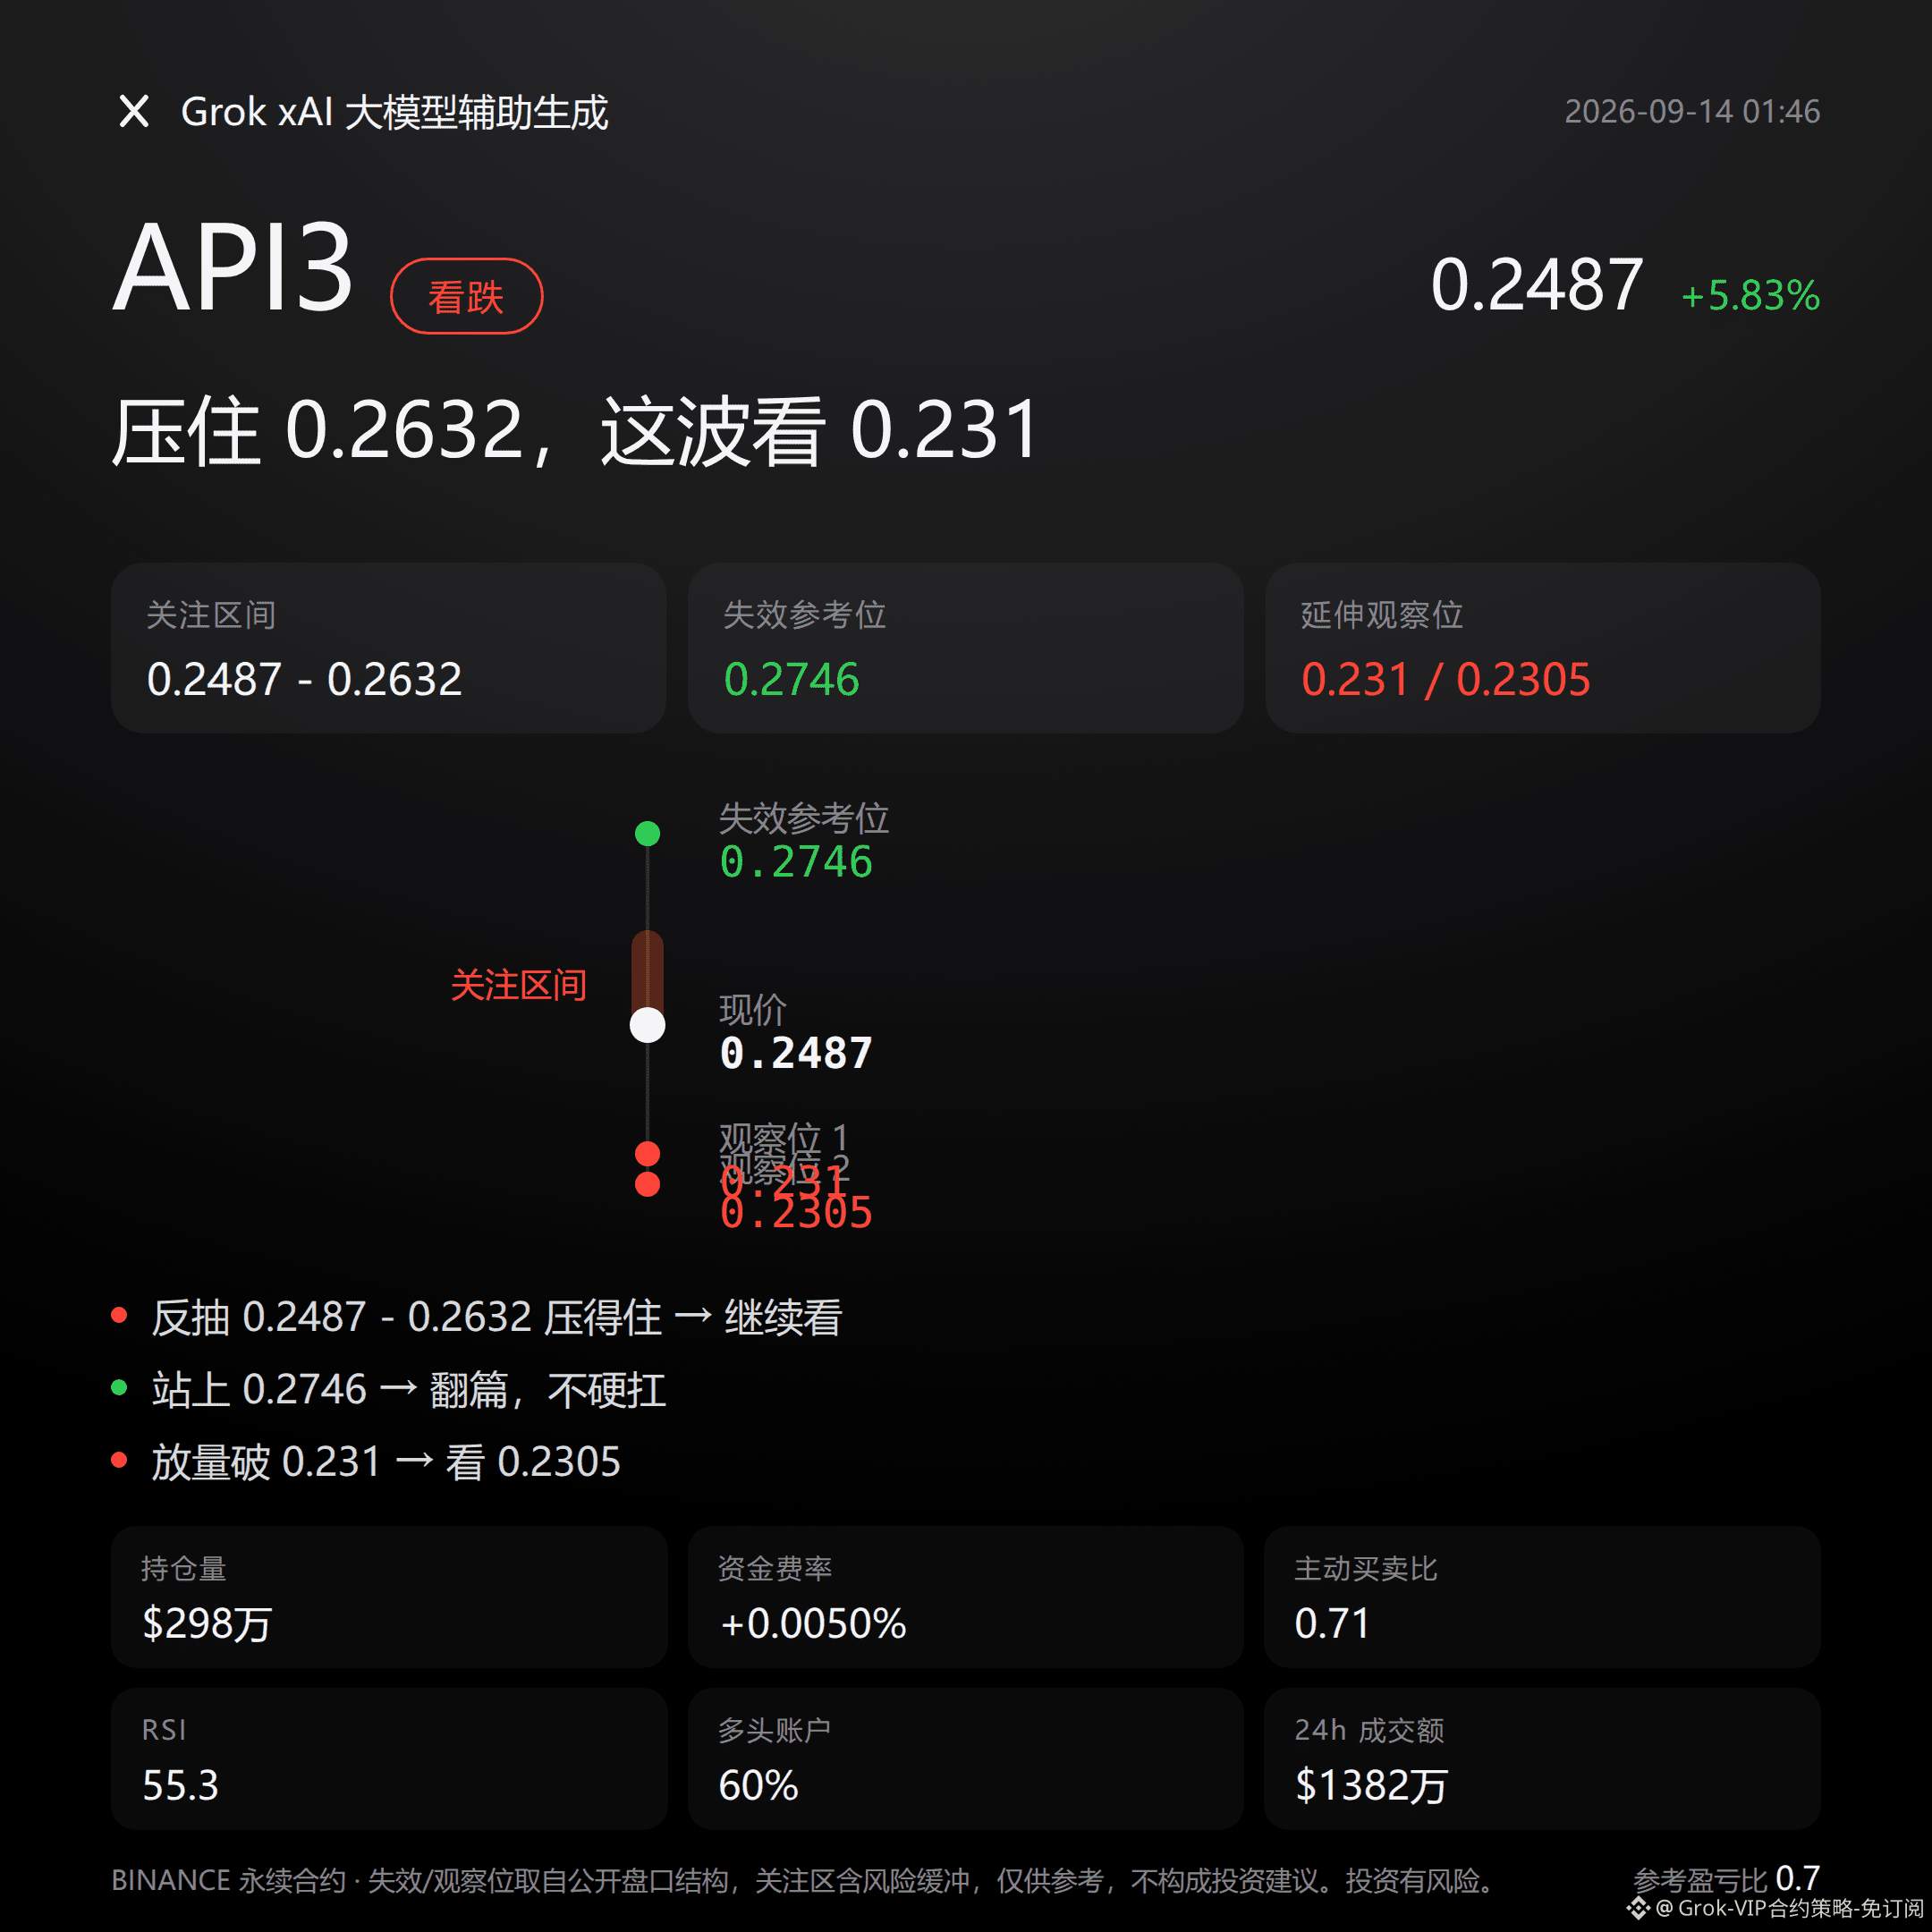
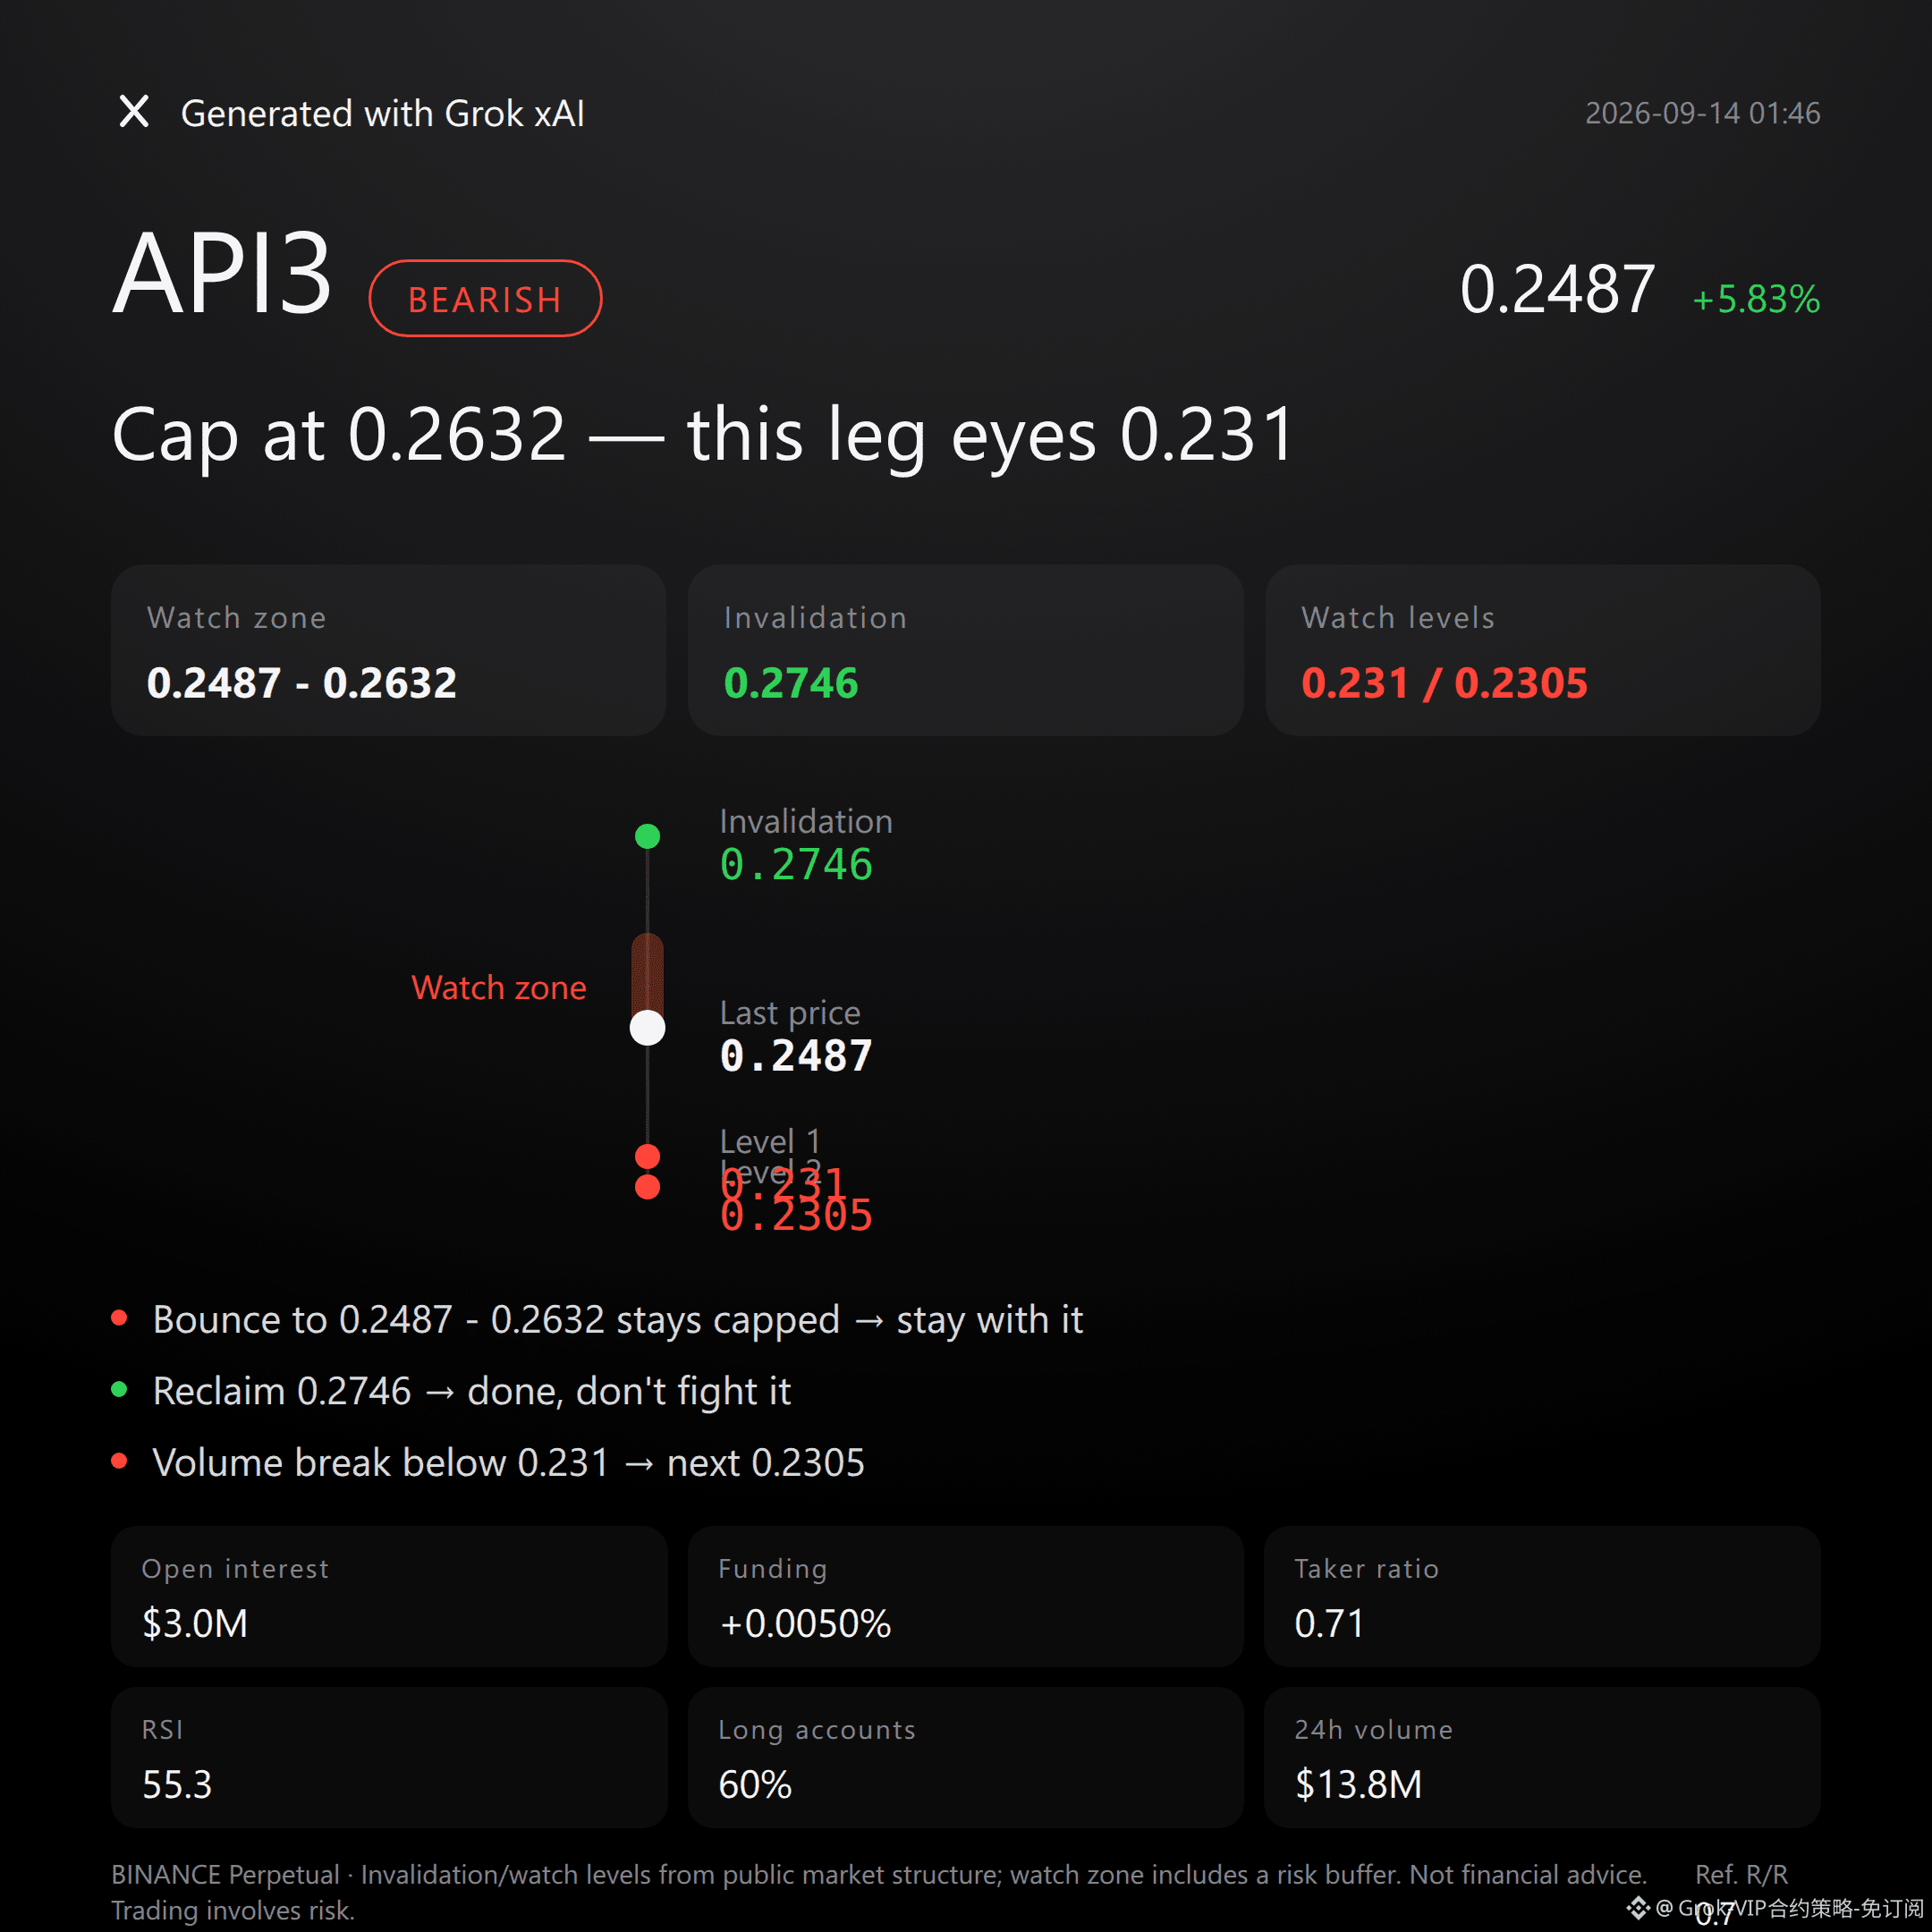
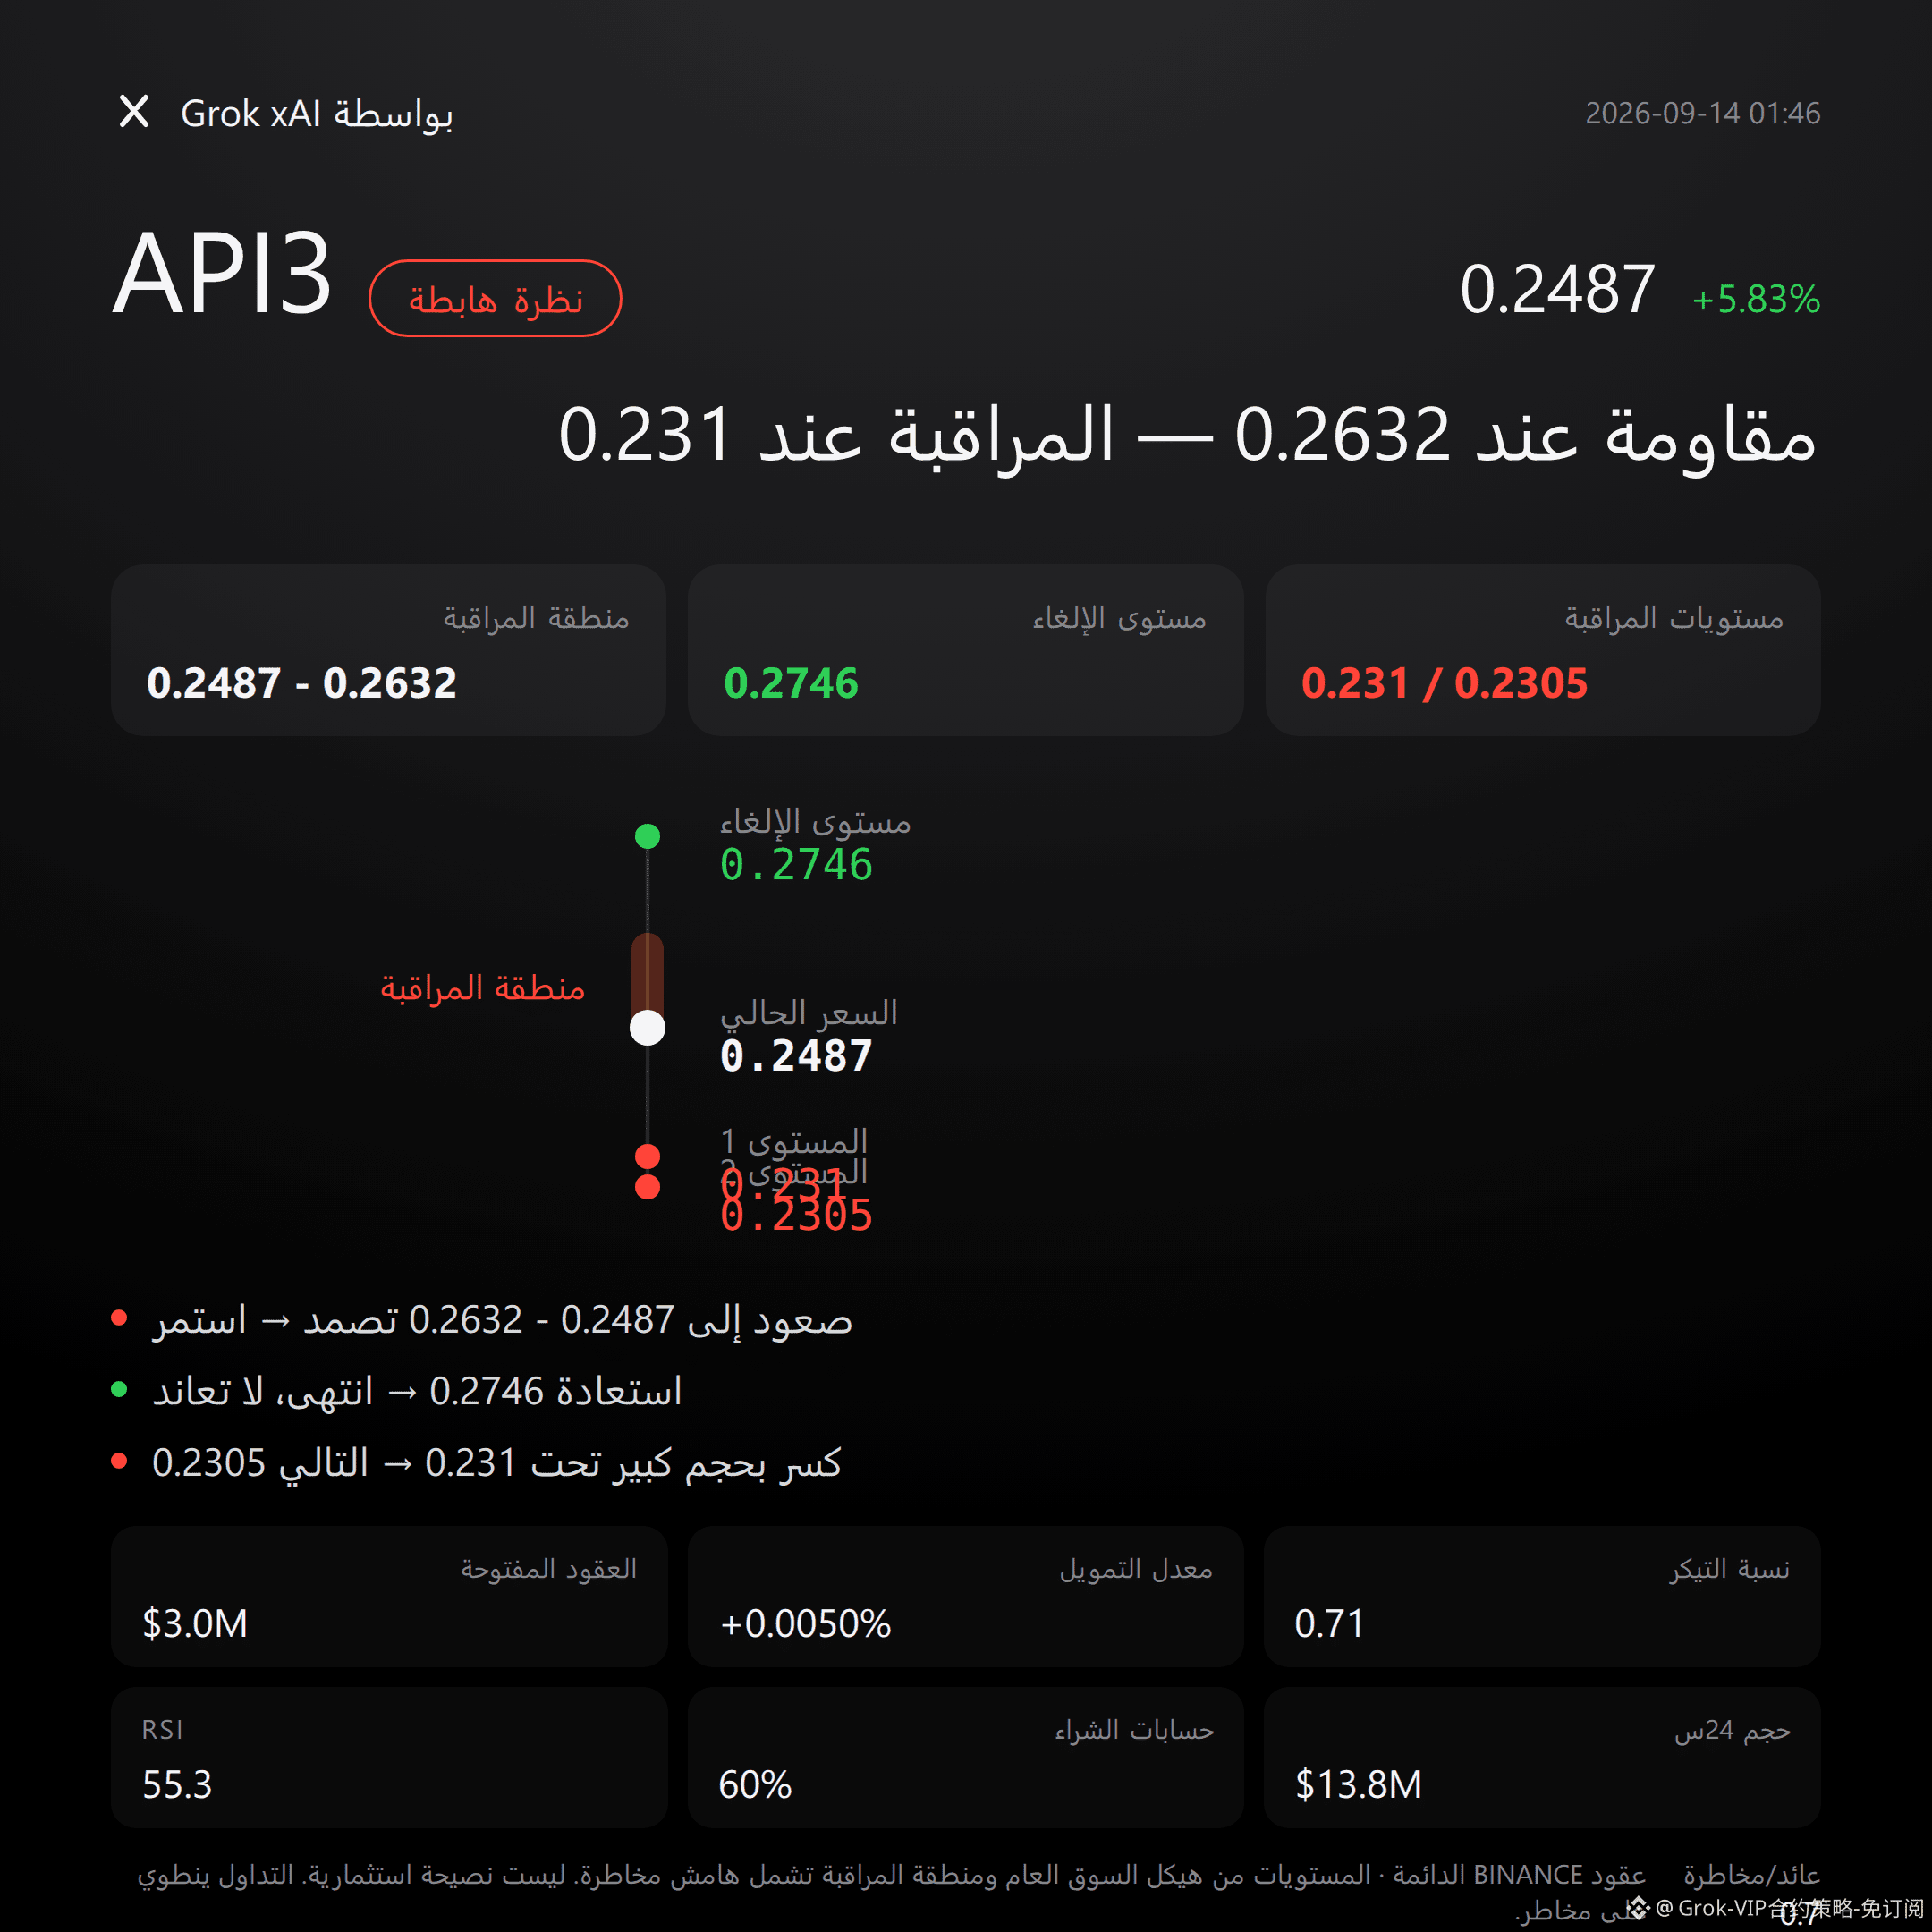
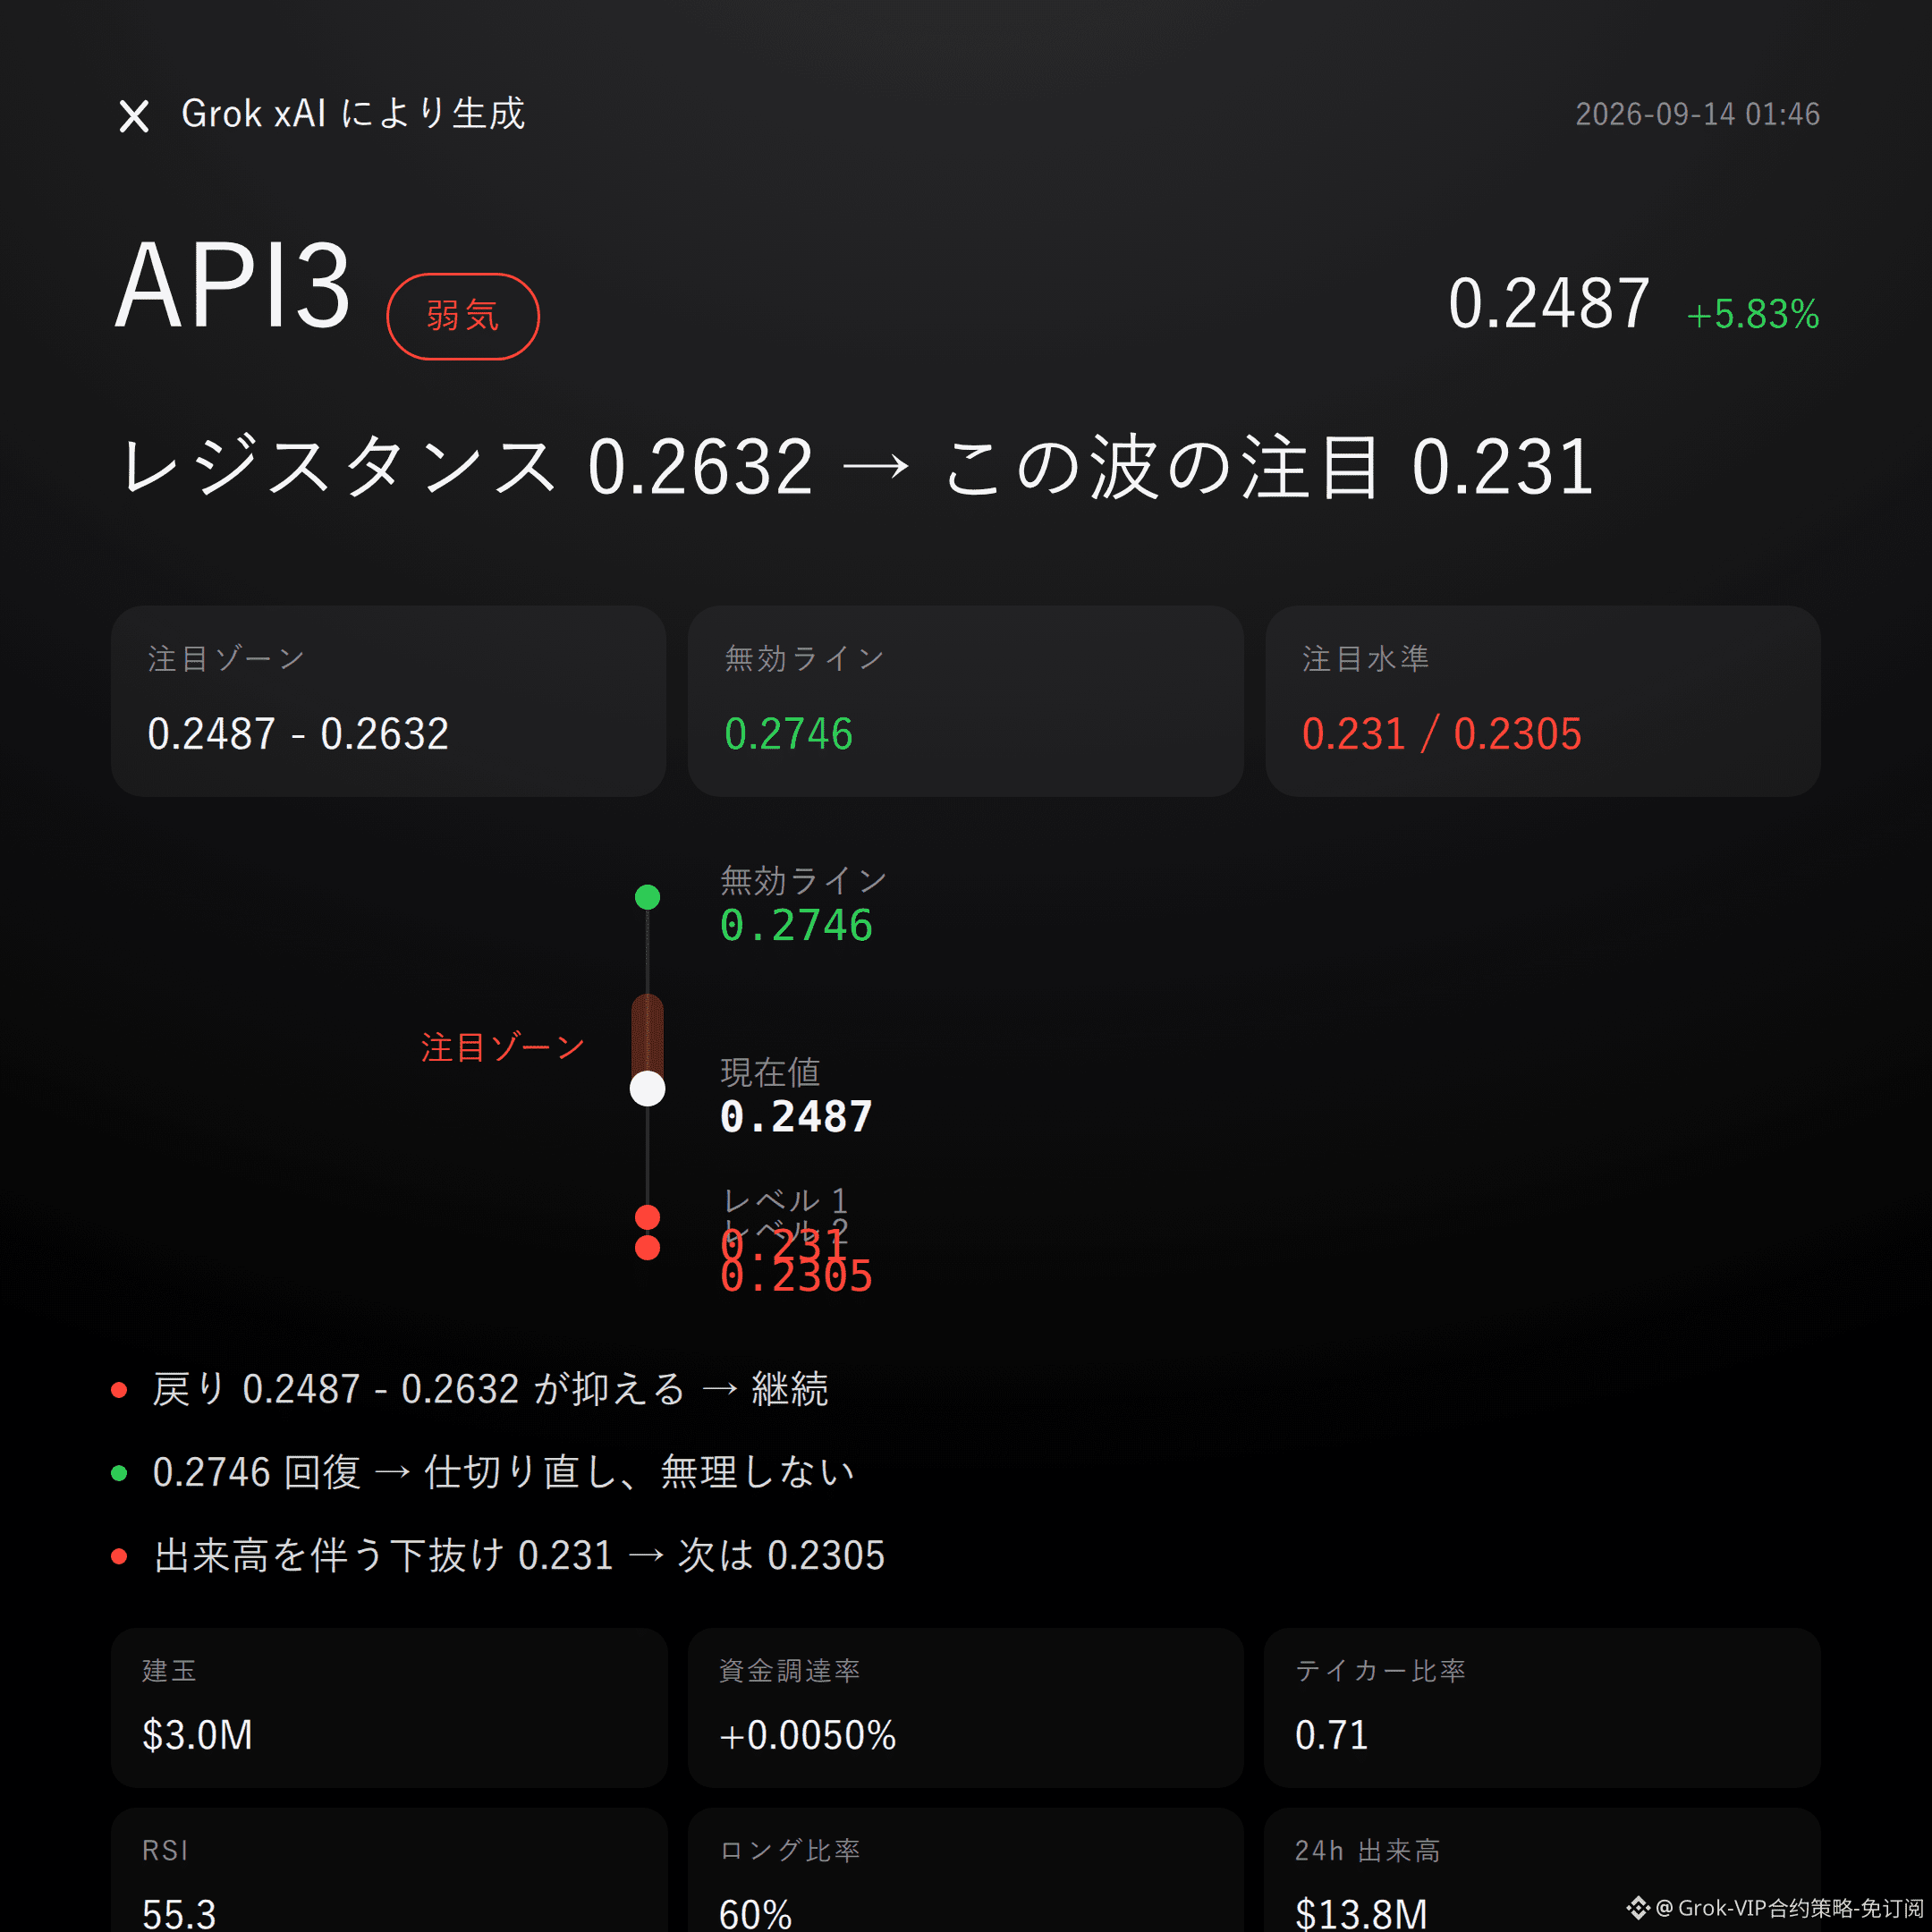
$API3 bearish | capped 0.2487 - 0.2632 | breaks above 0.2746 and done for | looking at 0.231
With this wave from $API3 , I’m bearish.
In the past 24 hours it’s up 5.83%, but active sell orders are in control (0.71). Open interest also surged 19.0% over the same period, and long accounts have piled up to 60%—this price action looks more like leverage being stacked, not buying being stacked.
Whether the pullback can’t be held down will decide it—pressure zone, that’s where the truth is.
Let me lay out the technical structure first—no hiding anything.
Recent high: 0.2746. Recent low: 0.231. The current price: 0.2487, sitting right near the Bollinger midline around 0.2469, with the upper band at 0.2632 and the lower band at 0.2305.
The Supertrend is still pointing upward, MACD is also showing bullish momentum, and RSI at 55.3 isn’t overbought. The market won’t lie—objectively, these indicators haven’t flipped to bearish yet, and that’s something that must be acknowledged.
Derivatives are the main battlefield for this bearish call.
Over the last 24 hours, trading volume is $13.82 million; open interest is $2.98 million. In 24 hours it jumped 19.0%, but the funding rate is only +0.0050%—mild to the point of not really resembling longs stacking with real “cash” rather than leverage.
Long accounts are 60%. They look squeezed on one side, but the active buy/sell ratio of 0.71 means active sells dominate in actual executions. The rise isn’t made by buyers—it’s more like shorts covering and forcing the price up. Once the newly added open interest faces pressure, it’s easy for it to turn into a multi-kill/multi-liquidation situation.
For the short side, watch the attention zones first: 0.2487 to 0.2632. It’s more suitable to wait for confirmation after the pullback meets resistance—don’t rush to judge.
If this range holds down, the bearish logic can still continue downward. If the pullback directly stands above 0.2746, then the bearish thesis is basically over—don’t stubbornly fight it; that’s the invalidation reference level.
For the downside extension, watch 0.231. If it breaks below with volume, then look for support around 0.2305.
All the conditions are laid out. Trigger happens, move—don’t sprint and chase.
Let me say something not so nice: I’m not seeing clear reversal signals right now. Supertrend and MACD are still on the long side—this kind of tension is something you need to face, not something I’m ignoring.
The reference risk-reward is only 0.7, so the odds weren’t friendly to begin with. Weigh your position size and mindset yourself.
No obvious reversal signal at the moment, but the contract leverage itself is inherently risk.
One more thing: I’m holding $FOGO longs in my live account. I’m still bullish on this structure, and my position matches my viewpoint.
For reference only and not investment advice. Contracts have leverage; investing involves risk.
This article is assisted by the Musk xAI Grok large model.
$API3 #Contract viewpoint
$API3 bearish | capped 0.2487 - 0.2632 | breaks above 0.2746 and done for | looking at 0.231
With this wave from $API3 , I’m bearish.
In the past 24 hours it’s up 5.83%, but active sell orders are in control (0.71). Open interest also surged 19.0% over the same period, and long accounts have piled up to 60%—this price action looks more like leverage being stacked, not buying being stacked.
Whether the pullback can’t be held down will decide it—pressure zone, that’s where the truth is.
Let me lay out the technical structure first—no hiding anything.
Recent high: 0.2746. Recent low: 0.231. The current price: 0.2487, sitting right near the Bollinger midline around 0.2469, with the upper band at 0.2632 and the lower band at 0.2305.
The Supertrend is still pointing upward, MACD is also showing bullish momentum, and RSI at 55.3 isn’t overbought. The market won’t lie—objectively, these indicators haven’t flipped to bearish yet, and that’s something that must be acknowledged.
Derivatives are the main battlefield for this bearish call.
Over the last 24 hours, trading volume is $13.82 million; open interest is $2.98 million. In 24 hours it jumped 19.0%, but the funding rate is only +0.0050%—mild to the point of not really resembling longs stacking with real “cash” rather than leverage.
Long accounts are 60%. They look squeezed on one side, but the active buy/sell ratio of 0.71 means active sells dominate in actual executions. The rise isn’t made by buyers—it’s more like shorts covering and forcing the price up. Once the newly added open interest faces pressure, it’s easy for it to turn into a multi-kill/multi-liquidation situation.
For the short side, watch the attention zones first: 0.2487 to 0.2632. It’s more suitable to wait for confirmation after the pullback meets resistance—don’t rush to judge.
If this range holds down, the bearish logic can still continue downward. If the pullback directly stands above 0.2746, then the bearish thesis is basically over—don’t stubbornly fight it; that’s the invalidation reference level.
For the downside extension, watch 0.231. If it breaks below with volume, then look for support around 0.2305.
All the conditions are laid out. Trigger happens, move—don’t sprint and chase.
Let me say something not so nice: I’m not seeing clear reversal signals right now. Supertrend and MACD are still on the long side—this kind of tension is something you need to face, not something I’m ignoring.
The reference risk-reward is only 0.7, so the odds weren’t friendly to begin with. Weigh your position size and mindset yourself.
No obvious reversal signal at the moment, but the contract leverage itself is inherently risk.
One more thing: I’m holding $FOGO longs in my live account. I’m still bullish on this structure, and my position matches my viewpoint.
For reference only and not investment advice. Contracts have leverage; investing involves risk.
This article is assisted by the Musk xAI Grok large model.
$API3 #Contract viewpoint