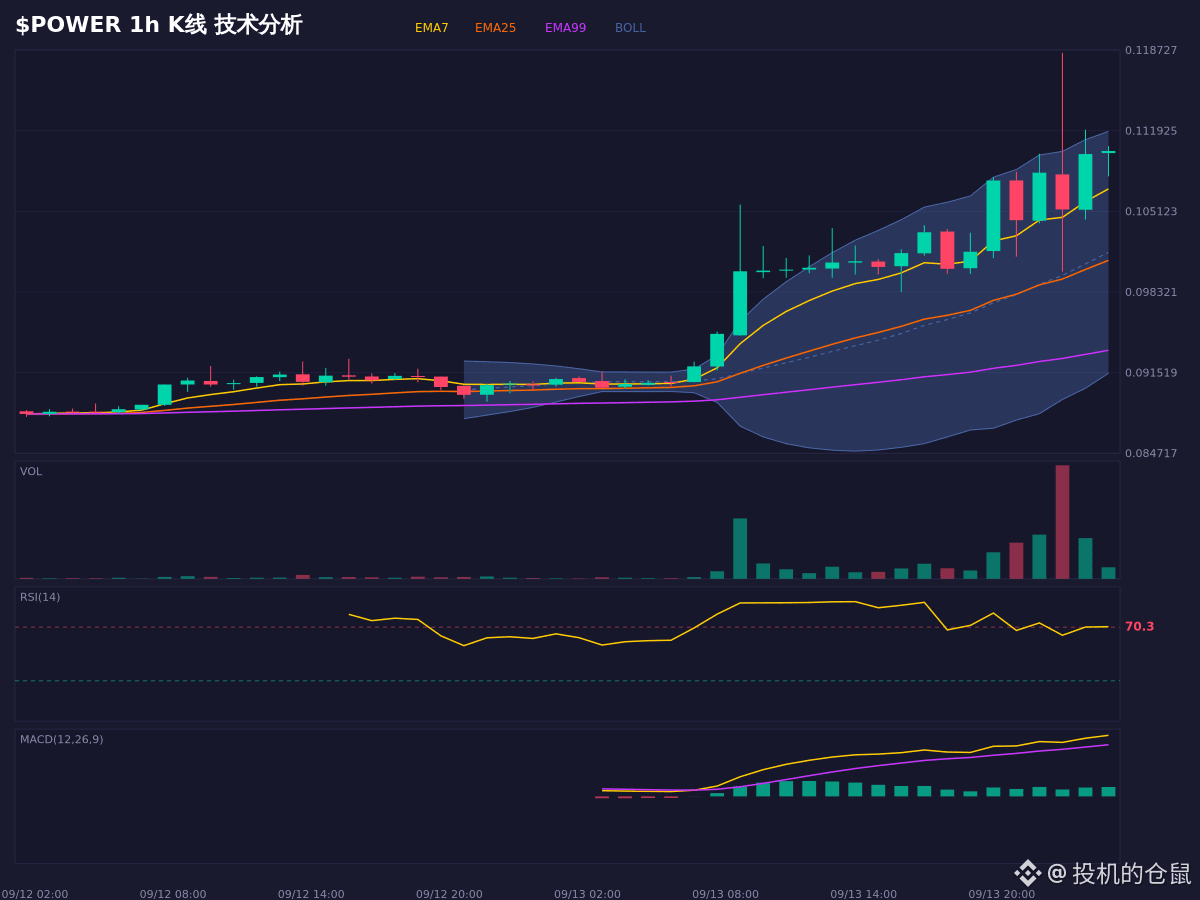
$POWER This market move is a bit interesting. The moving averages in a bullish alignment are indeed strong, but the RSI at 89.3 is already severely overbought, and there are also top divergence signals. This rally feels a little shaky. Stoch RSI is also oversold at 17.2, making it whipsaw back and forth—really tiring.
Bollinger Band width at 20% indicates the volatility isn’t small.
Key levels: Around 0.1076 there’s a confluence support from the Fib 38.2% and the EMA25. If price holds above it, you could look for continuation; if it breaks below 0.0988, the current bullish bias logic would no longer hold.
For chart observation and scenario analysis only—this does not constitute a trading operation record.
$POWER #永续合约 #熊市 #Contract
Bollinger Band width at 20% indicates the volatility isn’t small.
Key levels: Around 0.1076 there’s a confluence support from the Fib 38.2% and the EMA25. If price holds above it, you could look for continuation; if it breaks below 0.0988, the current bullish bias logic would no longer hold.
For chart observation and scenario analysis only—this does not constitute a trading operation record.
$POWER #永续合约 #熊市 #Contract