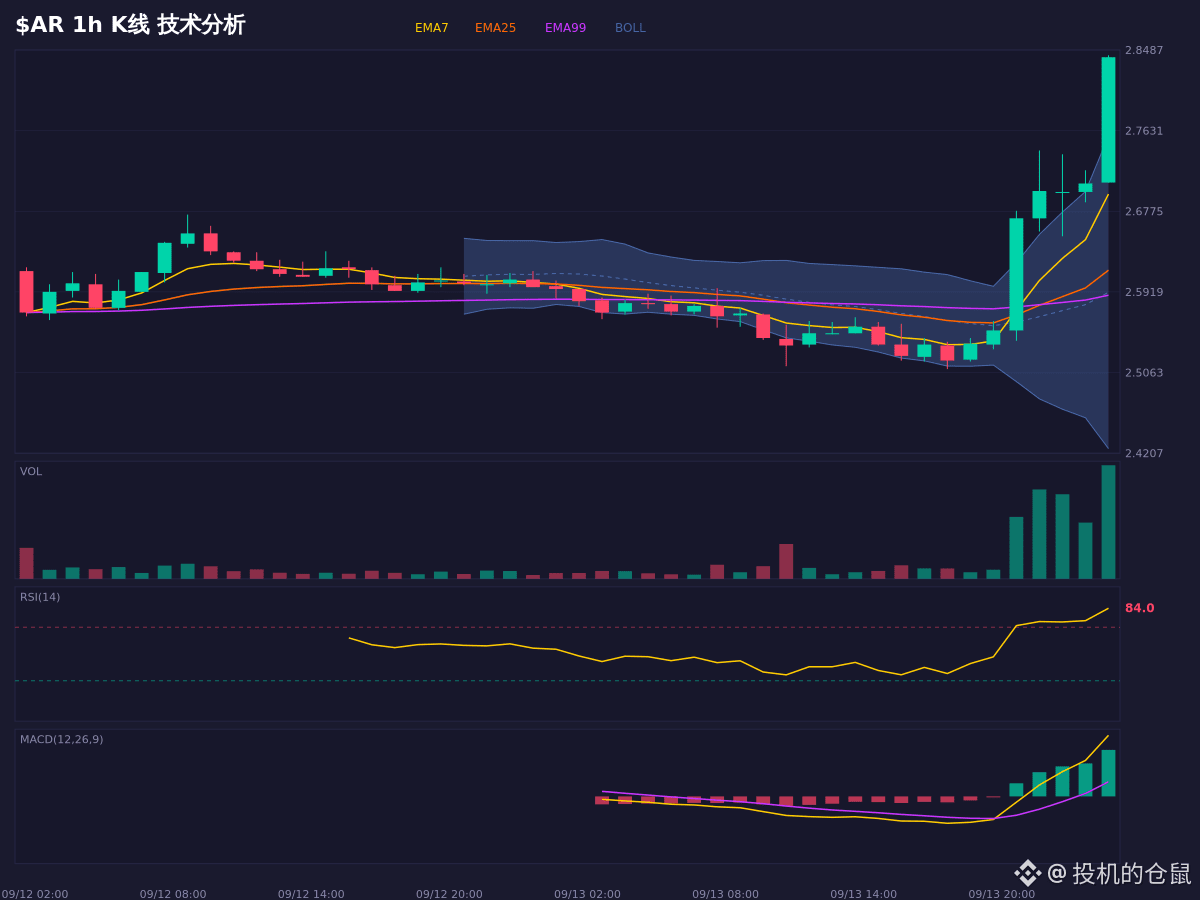
$AR This wave is pushing to 2.8410—yeah, that’s pretty fierce. But looking at the technicals: the short-term moving averages are indeed aligned bullishly. Still, the 1-hour RSI is directly up at 82.7—wow. That overbought level is absolutely intense. There’s likely considerable downside pullback pressure in the short term.
The Bollinger Bands have also broken above the upper band; this level of strength usually creates a need for mean reversion. The key is whether the pullback can hold around the EMA25 area. As long as 2.6168 doesn’t break, the bullish structure can continue.
If it holds the 2.6755~2.7146 range, you can still look for longs; but if it directly breaks below 2.5932, then the current logic fails. Chasing is definitely high-risk, and short-term consolidation is inevitable.
For market observation and scenario analysis only; not a record of trading actions.
$AR #合约 #永续合约 #Market sentiment
The Bollinger Bands have also broken above the upper band; this level of strength usually creates a need for mean reversion. The key is whether the pullback can hold around the EMA25 area. As long as 2.6168 doesn’t break, the bullish structure can continue.
If it holds the 2.6755~2.7146 range, you can still look for longs; but if it directly breaks below 2.5932, then the current logic fails. Chasing is definitely high-risk, and short-term consolidation is inevitable.
For market observation and scenario analysis only; not a record of trading actions.
$AR #合约 #永续合约 #Market sentiment