Want to know if the market is topping or just resetting for the next leg higher?
Stan Weinstein's framework gives us one of the simplest ways to answer it.
The Nasdaq ran 34% from the March low to the June high. Then it spent three months going nowhere.
The key is the 30-week moving average.
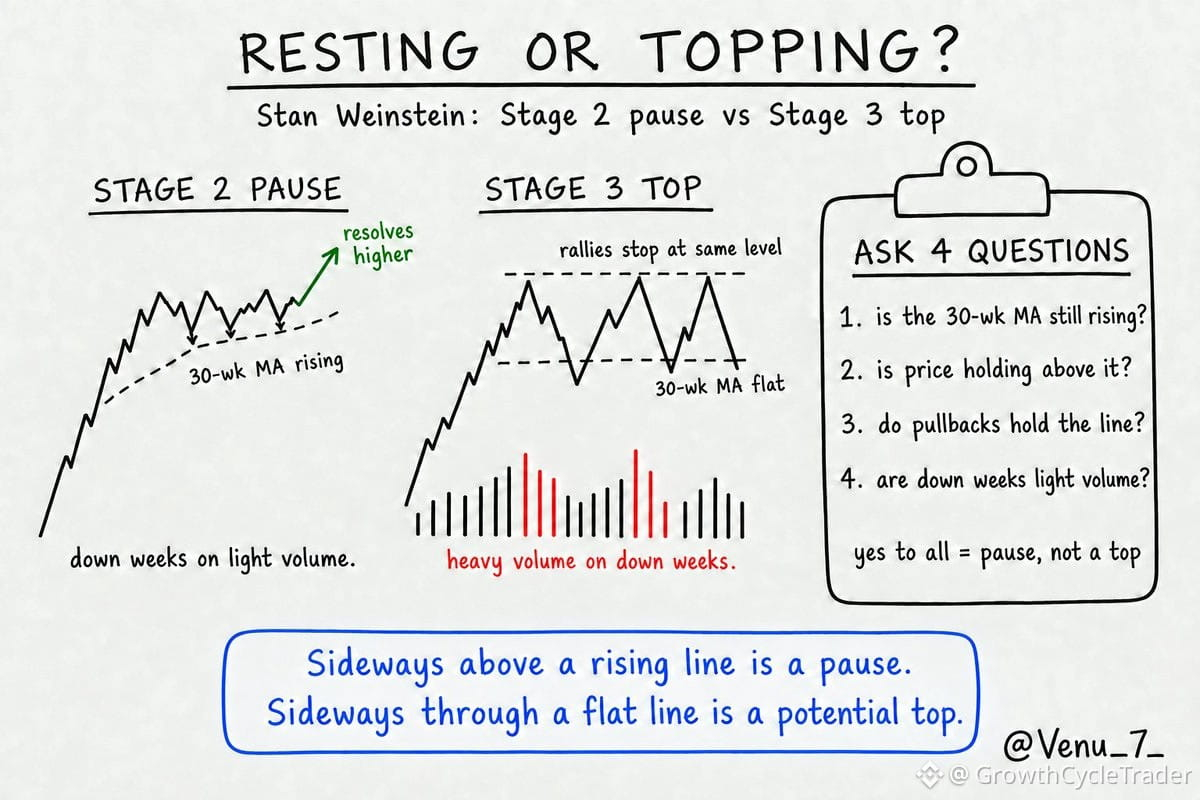
Stage 2 pause:
- 30-week MA still rising
- Price holds above it, pullbacks find support near the line
- Down weeks come on lighter volume
- The range eventually resolves higher
Stage 3 top:
- 30-week MA flattens out
- Price whips above and below the line
- Heavy volume shows up on down weeks
- Rallies keep failing at the same level
Right now, $QQQ sits above a 30-week line that is still rising.
By Weinstein's framework, that looks more like a Stage 2 pause than a Stage 3 top.
That can change. The line flattening is the tell.
Until it does, the trend gets the benefit of the doubt.
Sideways above a rising line = pause.
Sideways through a flat line = potential top.
The market doesn't need to go up every week to remain in an uptrend.
Sometimes the strongest moves come after months of doing nothing. We've seen this again and again — October 2023, April 2025, November 2025, and March 2026 are some of the best examples.
Until the 30-week MA tells us otherwise, the primary trend remains intact.
Stan Weinstein's framework gives us one of the simplest ways to answer it.
The Nasdaq ran 34% from the March low to the June high. Then it spent three months going nowhere.
The key is the 30-week moving average.
Stage 2 pause:
- 30-week MA still rising
- Price holds above it, pullbacks find support near the line
- Down weeks come on lighter volume
- The range eventually resolves higher
Stage 3 top:
- 30-week MA flattens out
- Price whips above and below the line
- Heavy volume shows up on down weeks
- Rallies keep failing at the same level
Right now, $QQQ sits above a 30-week line that is still rising.
By Weinstein's framework, that looks more like a Stage 2 pause than a Stage 3 top.
That can change. The line flattening is the tell.
Until it does, the trend gets the benefit of the doubt.
Sideways above a rising line = pause.
Sideways through a flat line = potential top.
The market doesn't need to go up every week to remain in an uptrend.
Sometimes the strongest moves come after months of doing nothing. We've seen this again and again — October 2023, April 2025, November 2025, and March 2026 are some of the best examples.
Until the 30-week MA tells us otherwise, the primary trend remains intact.