Trading Thesis | 9/14 00:21
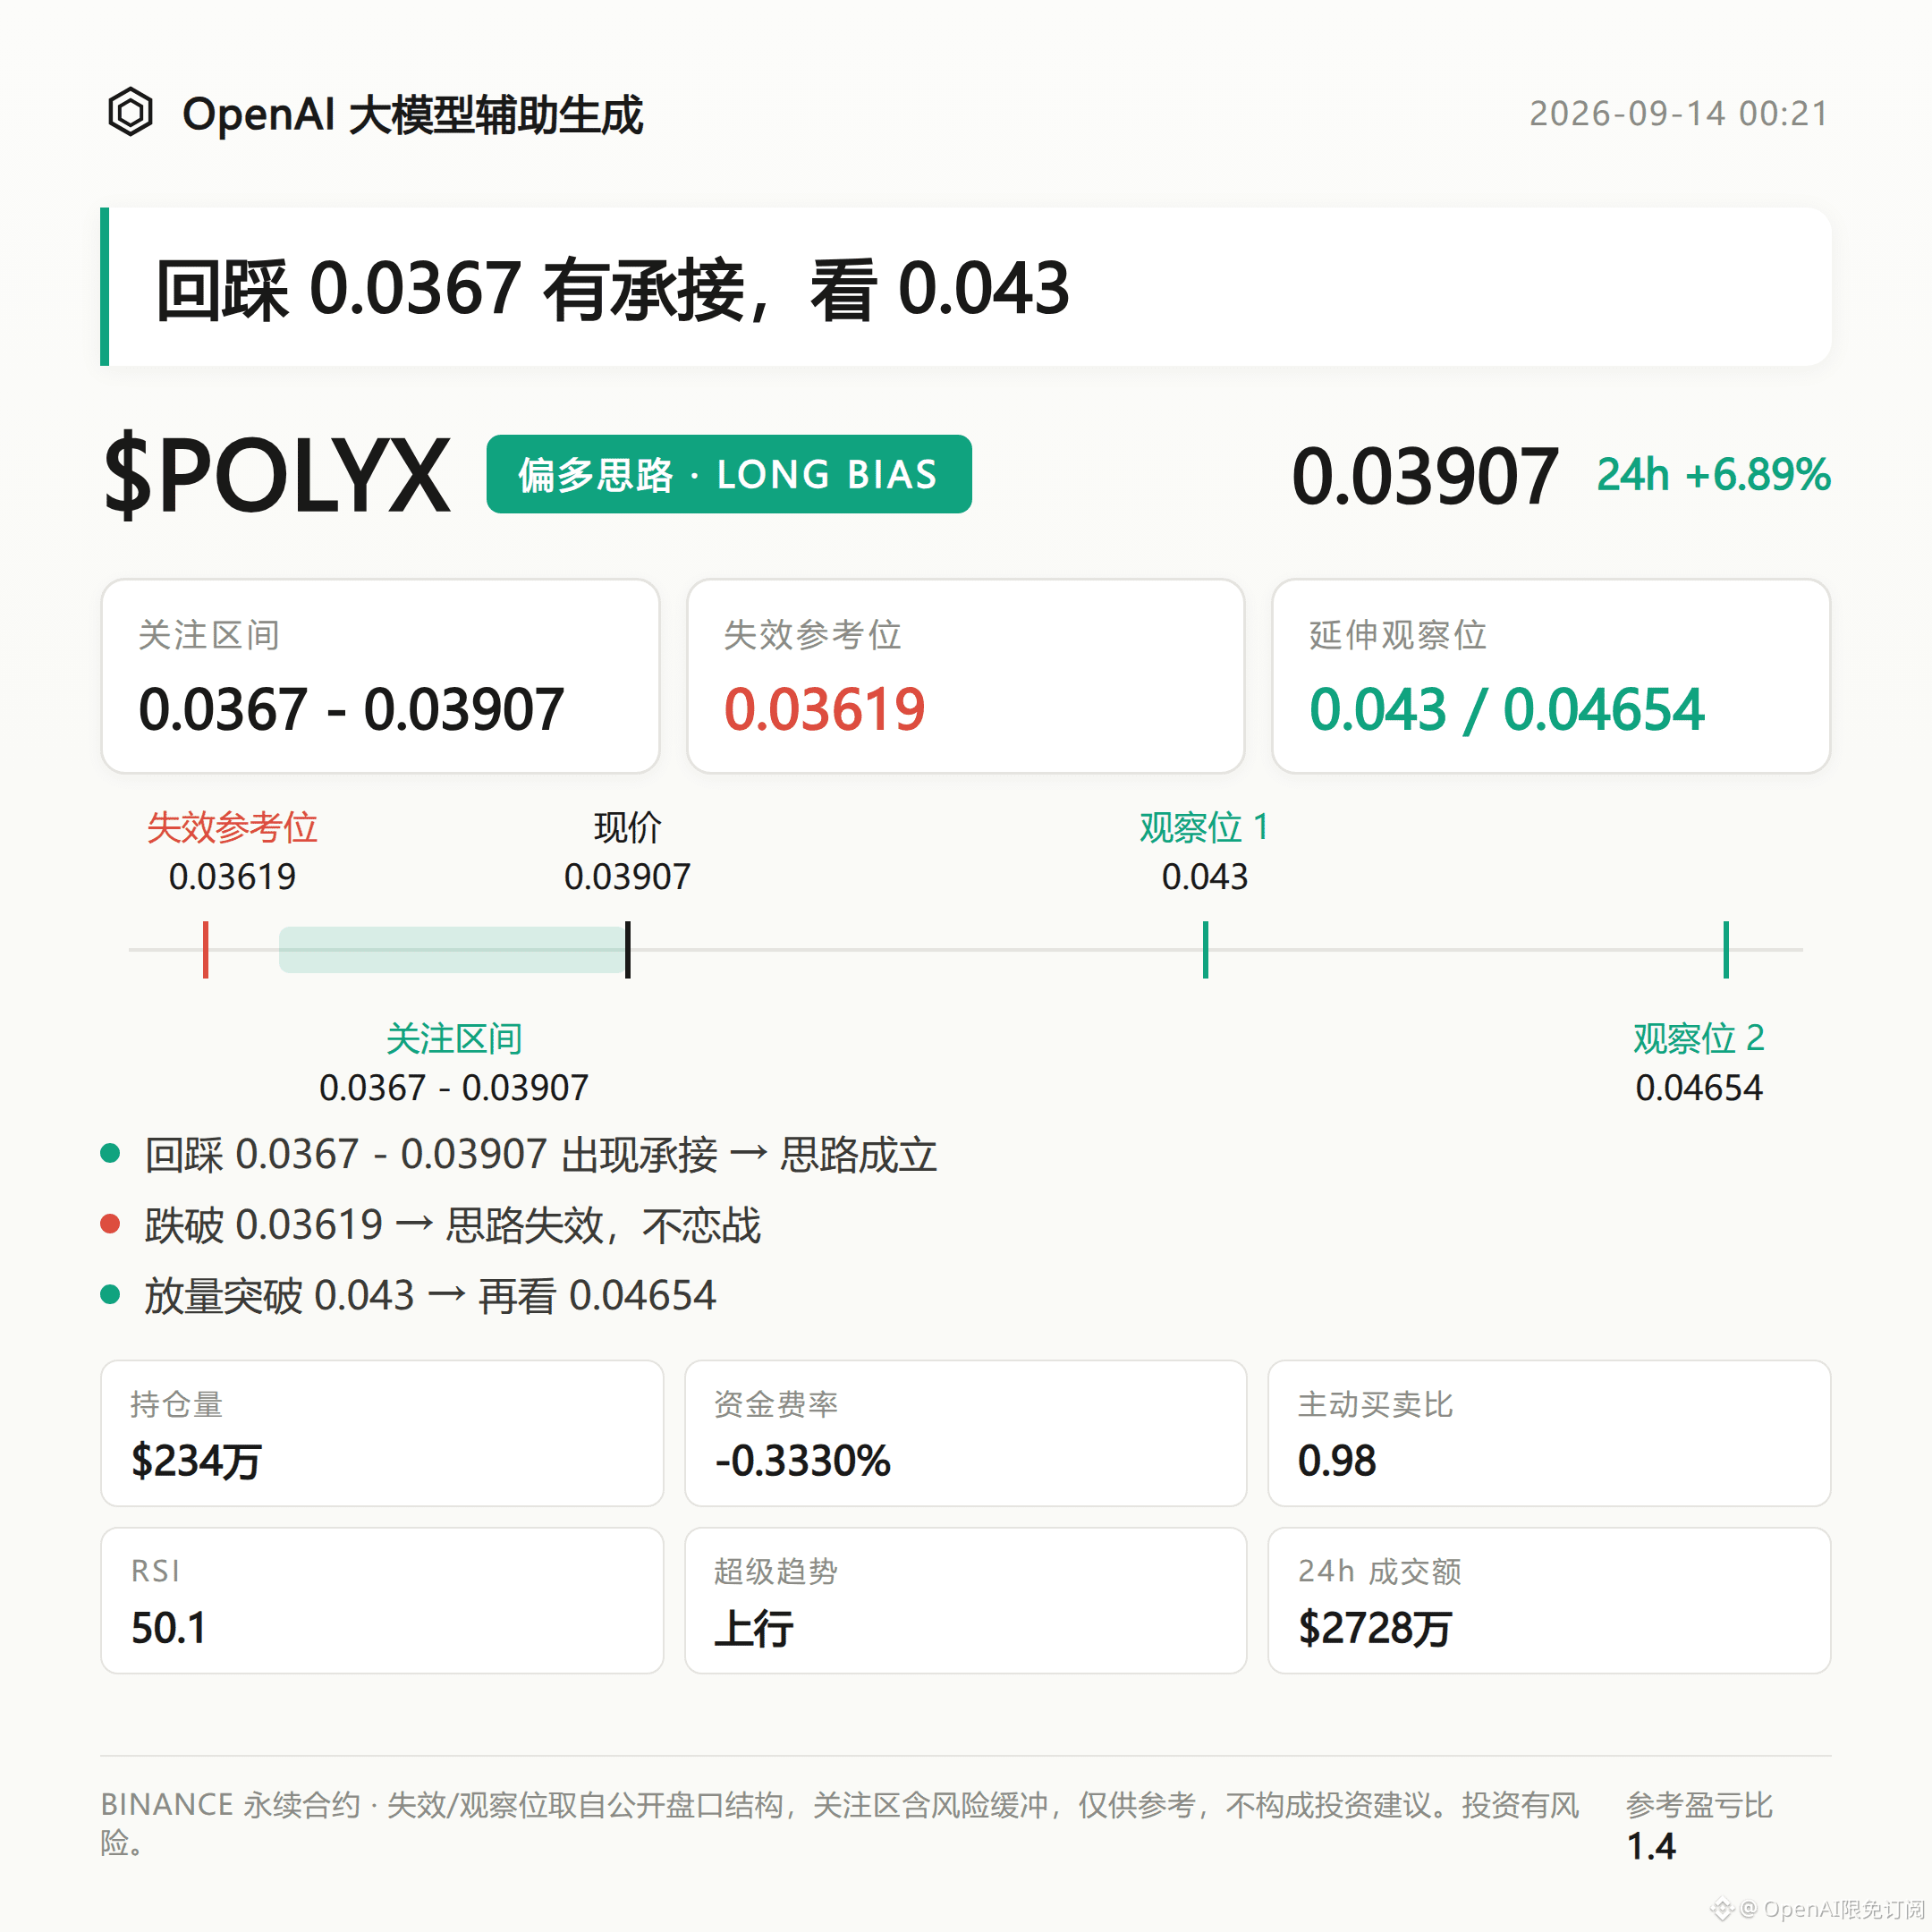
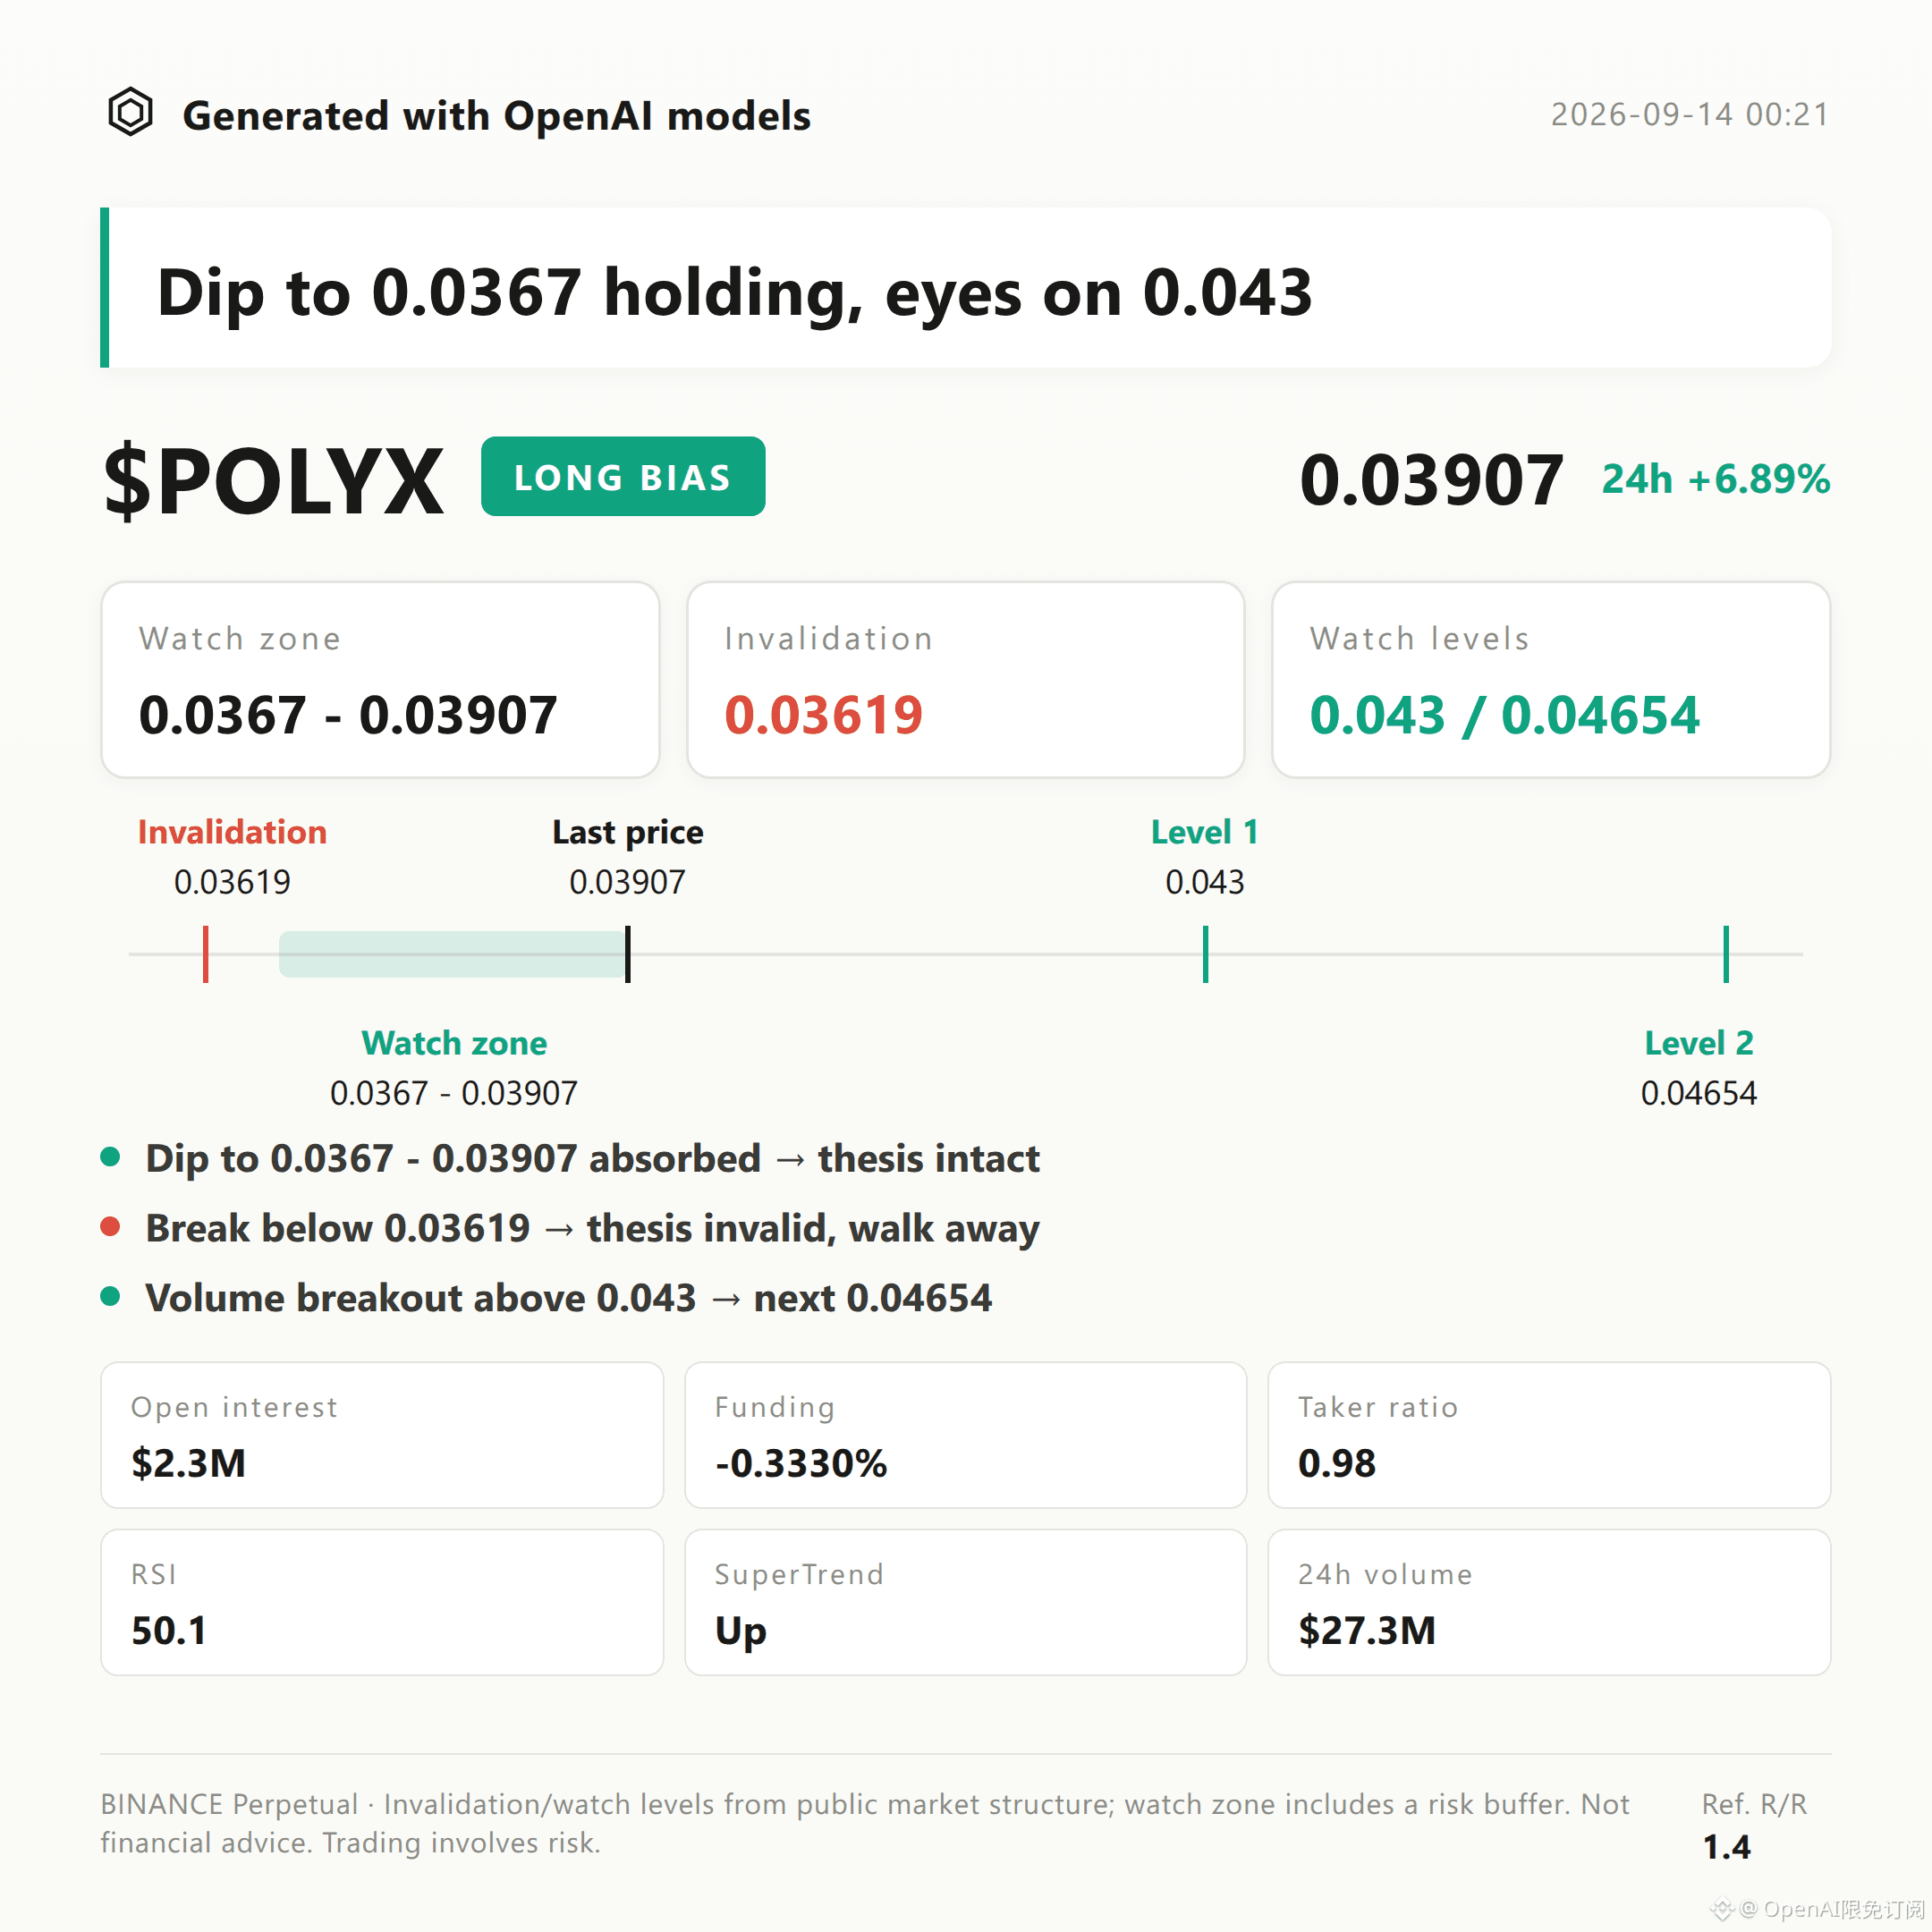
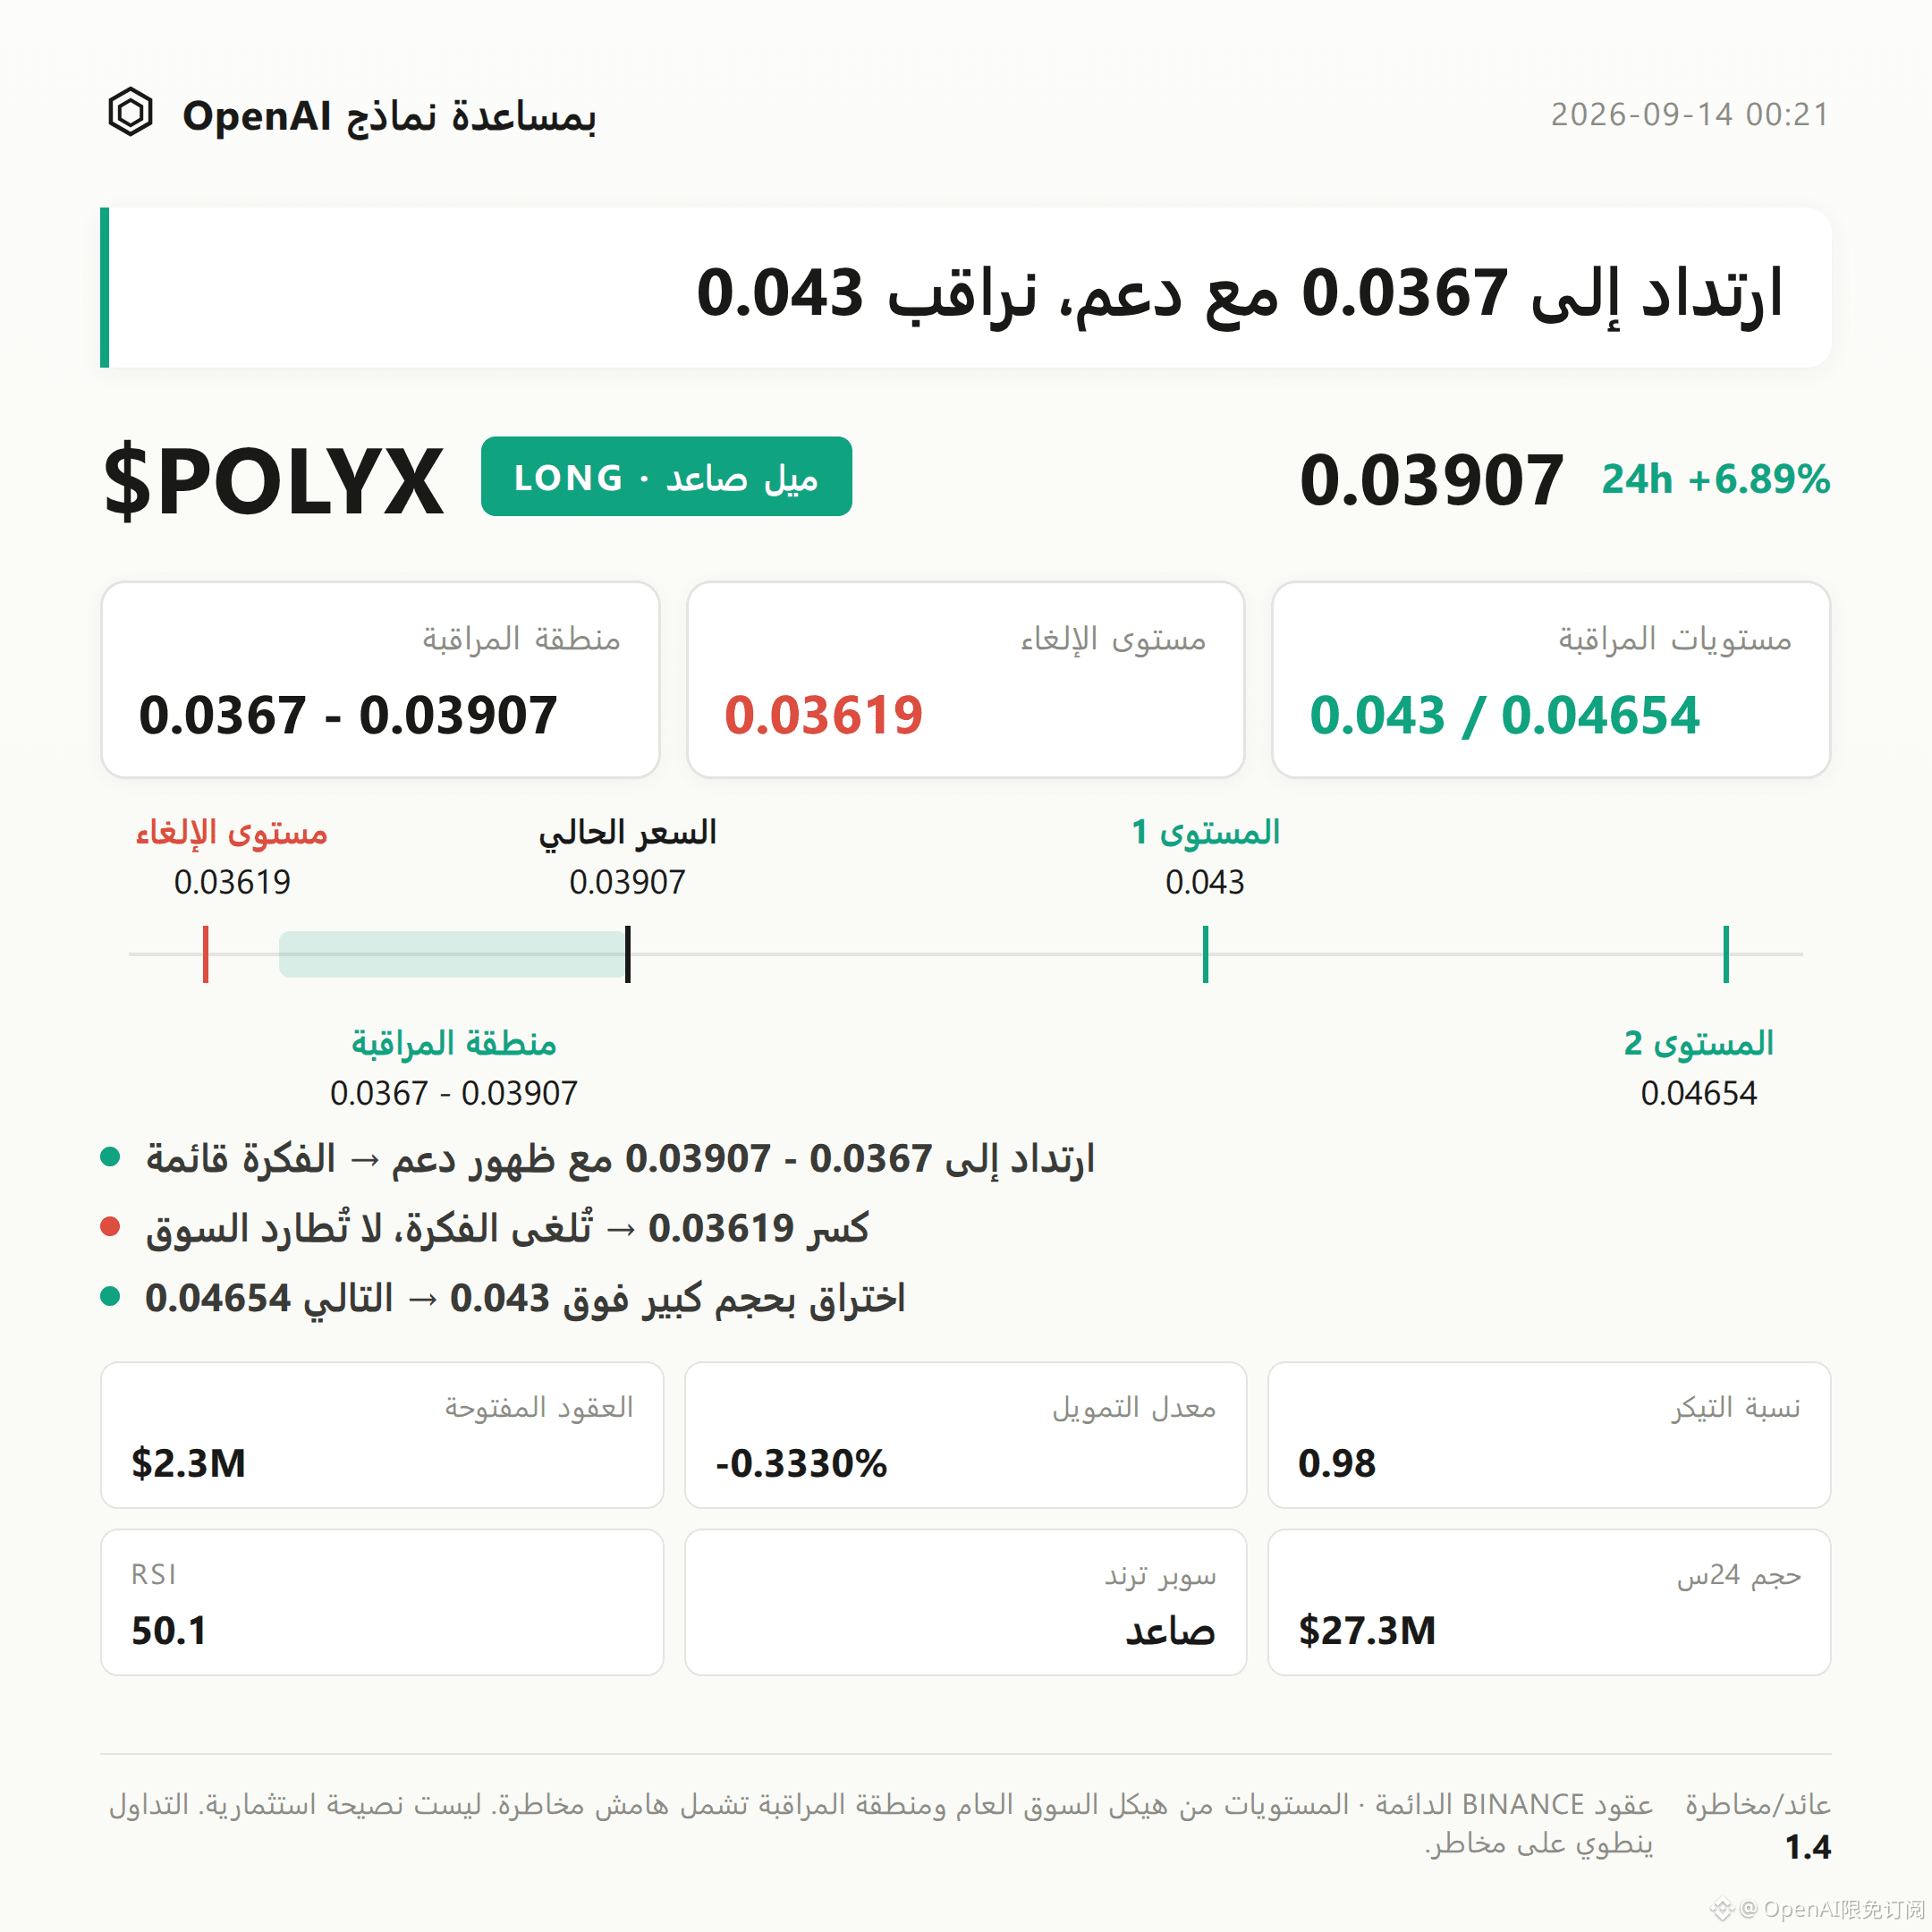
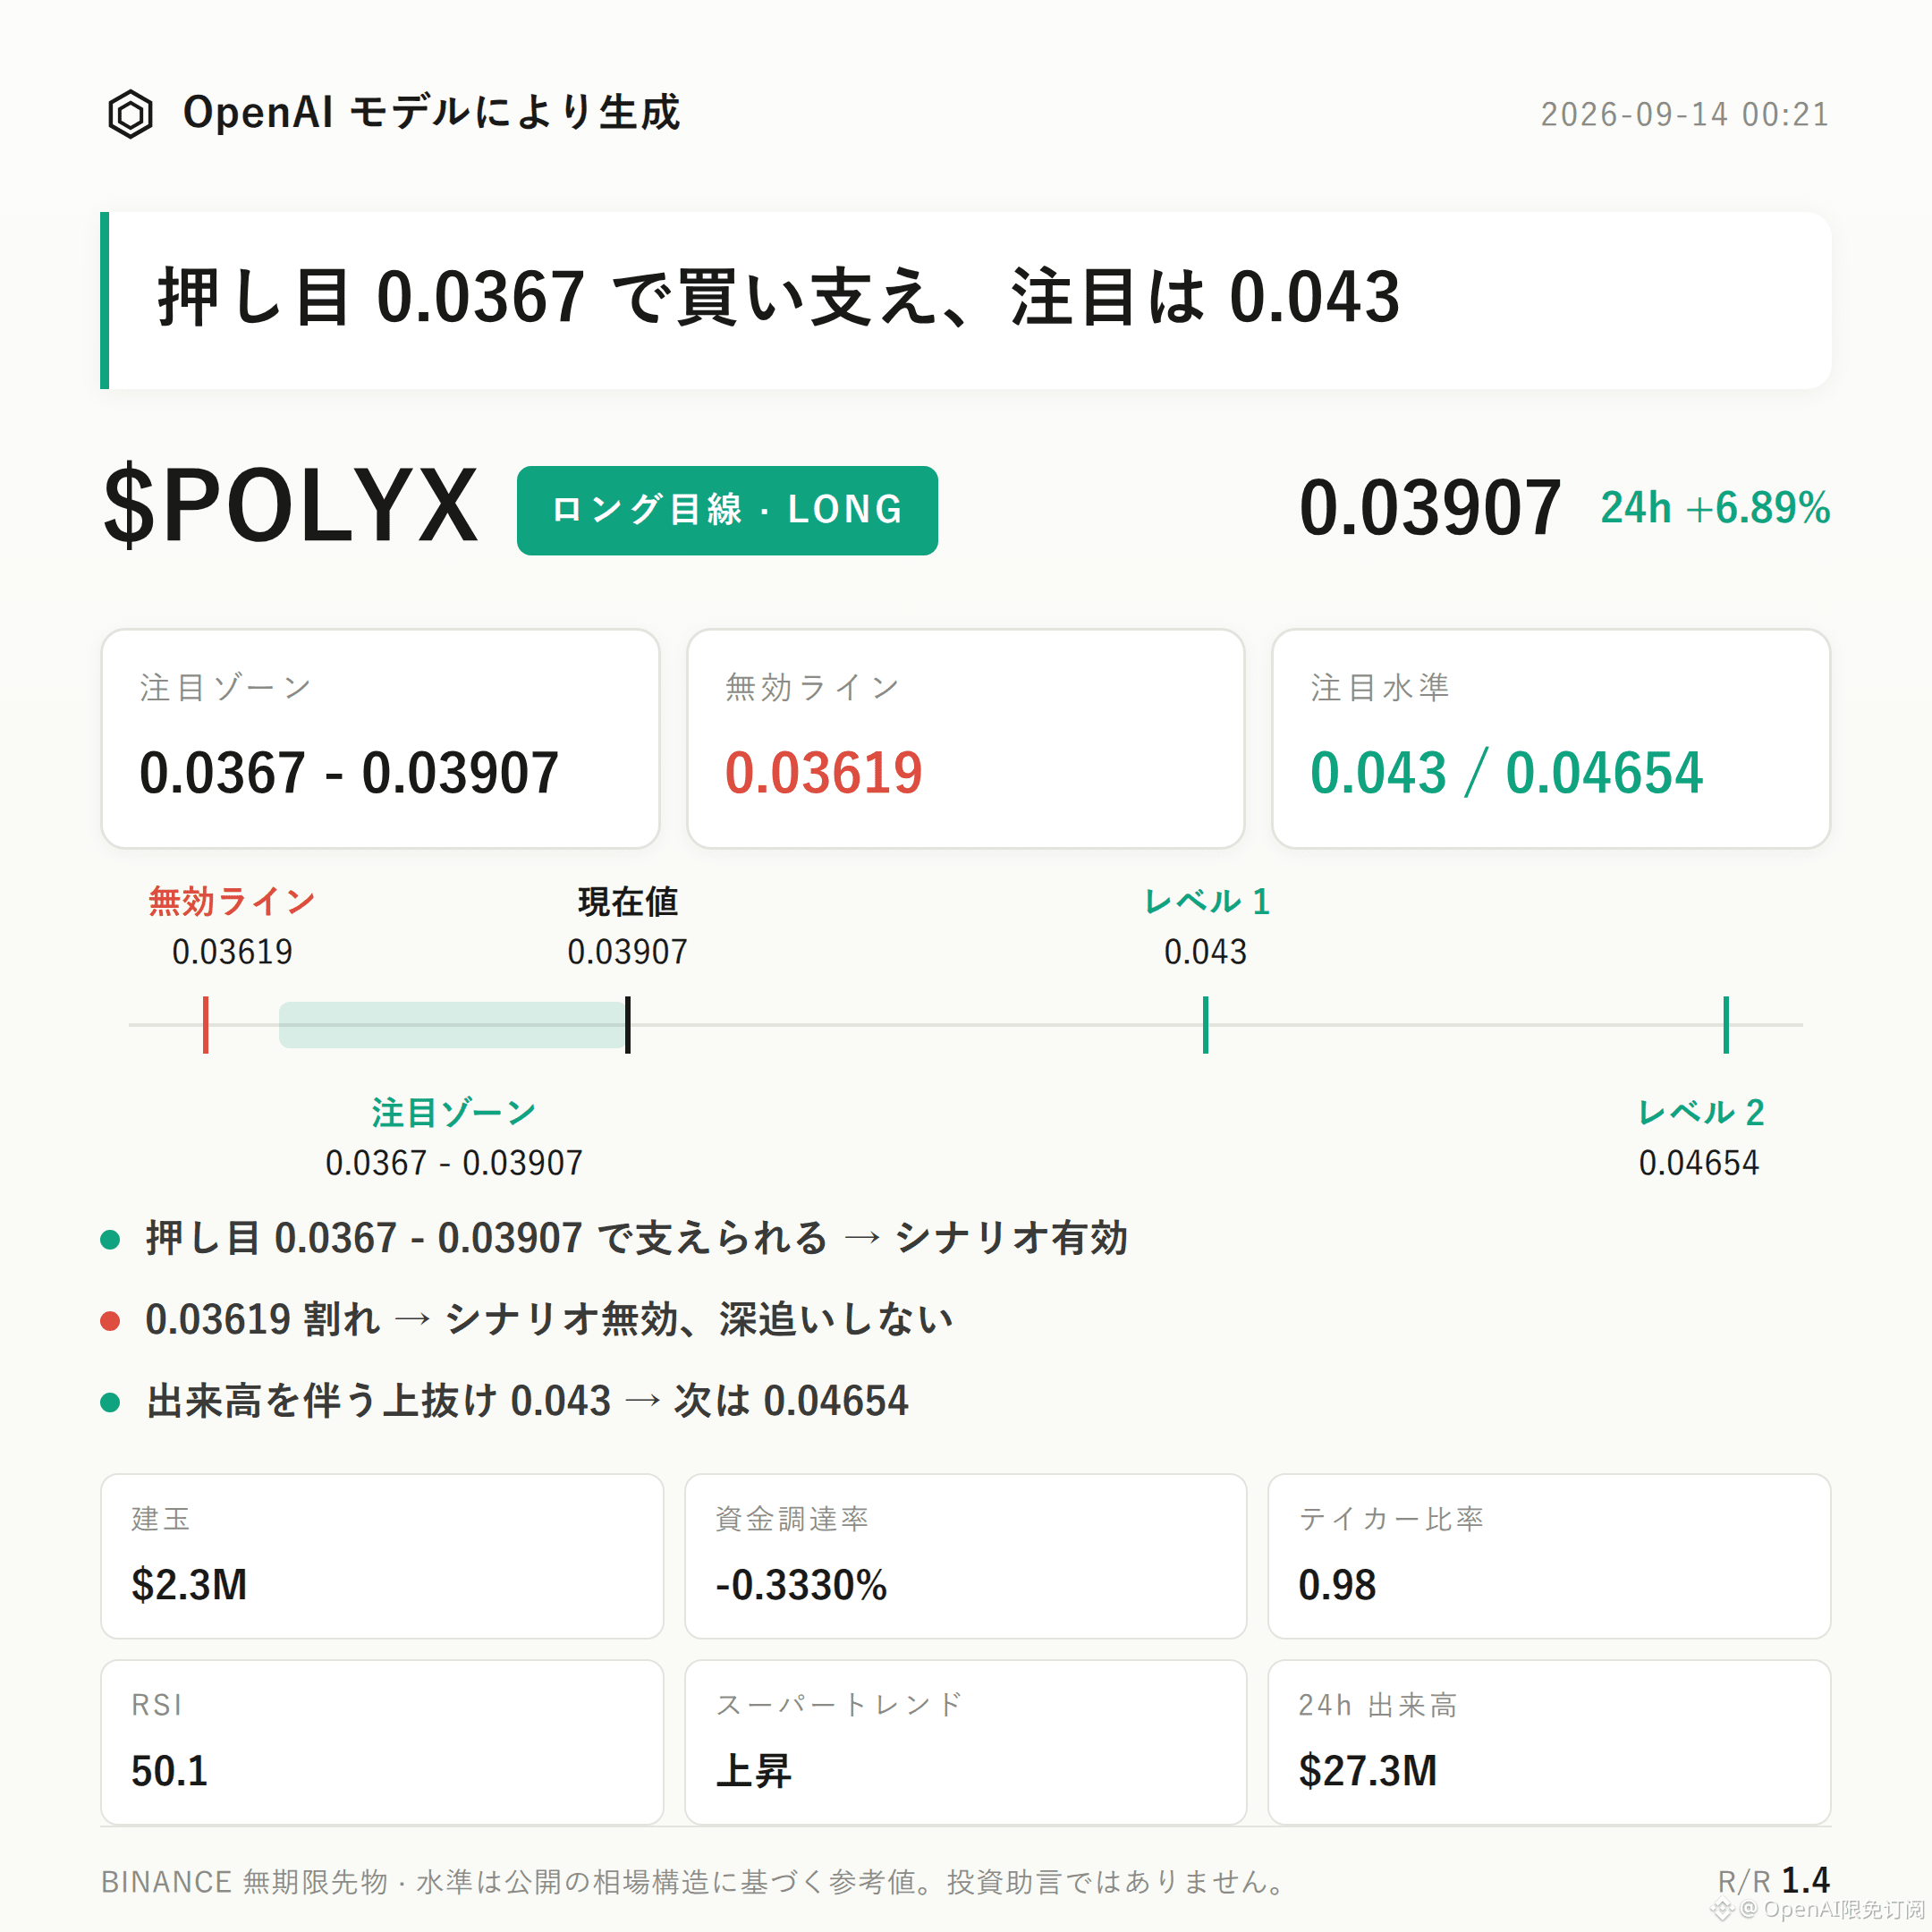
$POLYX Bias: Long. | Focus Zone: 0.0367 - 0.03907 | Invalidation Reference: 0.03619 | Observation Levels: 0.043 / 0.04654
The current structure for $POLYX is shifting to a bullish (long) bias.
The Supertrend remains pointing upward, the MACD holds bullish momentum, and the open interest/position volume has increased by 49.5% over the past 24 hours. This reflects a clear expansion in contract-market capital size—this is the core support for the current leg of structure.
Next, the key is to see whether the long side can continue to absorb within the focused zone, in order to verify whether the structure can truly hold.
From a technical-structure perspective: the recent high is 0.04654, the recent low is 0.03619. The price has risen 6.89% in the last 24 hours and is moving with the trend.
The Bollinger middle band is 0.0398, the upper band is 0.043. The current price at 0.03907 is above the middle band but has not yet touched the upper band.
RSI is 50.1, staying in a healthy range—neither overbought nor lacking upside room. Both the MACD bullish momentum and the Supertrend up-direction jointly confirm a technical bullish bias, though it is not overheated yet.
From the derivatives perspective: trading volume over the last 24 hours is $27.28 million, open interest is $2.34 million, and it has increased by 49.5% in 24 hours—showing strong intent of new capital entering.
The funding rate is -0.3330%. Long-side account share is 64%, meaning the long-versus-short structure is biased toward longs.
However, it needs to be stated clearly: the buy/sell ratio for active trading is 0.98, so the buy side is not in clear advantage. This suggests that the current rise is driven more by piling up existing positions rather than strong active buying at the trade level—this is a bearish/contrarian signal that should be watched.
Regarding reference levels: for the long side, start with 0.0367 - 0.03907; it is more suitable to wait for confirmation after a pullback and absorption.
If price pulls back into this range and then shows signs of stabilization, the long-biased thesis can remain valid.
Set the invalidation level at 0.03619. If price breaks below this, it means the current upward structure is broken, the long thesis fails, and it should not be treated as valid under the original thesis.
For upside extension, watch 0.043. If volume continues to expand, then look around 0.04654 for resistance. Once price hits the resistance zone, you should reassess whether the momentum can continue.
The reference risk-reward ratio is about 1.4—only for structural reference.
The active buy/sell ratio of 0.98 shows the buy side is not currently dominant. If active buying remains weak afterward, price may keep oscillating repeatedly within the focus zone, and could even test the invalidation reference level. This should not be overlooked just because the market is rising.
Under contract leverage, position discipline is more important than directional guess.
Position note: This account holds a long position of $FOGO in live trading. Continue holding as long as the logic is not broken.
For reference only and does not constitute investment advice. Contracts involve leverage; investing is risky.
This article was generated with the assistance of an OpenAI large model.
$POLYX
#Futures contract analysis
$POLYX Bias: Long. | Focus Zone: 0.0367 - 0.03907 | Invalidation Reference: 0.03619 | Observation Levels: 0.043 / 0.04654
The current structure for $POLYX is shifting to a bullish (long) bias.
The Supertrend remains pointing upward, the MACD holds bullish momentum, and the open interest/position volume has increased by 49.5% over the past 24 hours. This reflects a clear expansion in contract-market capital size—this is the core support for the current leg of structure.
Next, the key is to see whether the long side can continue to absorb within the focused zone, in order to verify whether the structure can truly hold.
From a technical-structure perspective: the recent high is 0.04654, the recent low is 0.03619. The price has risen 6.89% in the last 24 hours and is moving with the trend.
The Bollinger middle band is 0.0398, the upper band is 0.043. The current price at 0.03907 is above the middle band but has not yet touched the upper band.
RSI is 50.1, staying in a healthy range—neither overbought nor lacking upside room. Both the MACD bullish momentum and the Supertrend up-direction jointly confirm a technical bullish bias, though it is not overheated yet.
From the derivatives perspective: trading volume over the last 24 hours is $27.28 million, open interest is $2.34 million, and it has increased by 49.5% in 24 hours—showing strong intent of new capital entering.
The funding rate is -0.3330%. Long-side account share is 64%, meaning the long-versus-short structure is biased toward longs.
However, it needs to be stated clearly: the buy/sell ratio for active trading is 0.98, so the buy side is not in clear advantage. This suggests that the current rise is driven more by piling up existing positions rather than strong active buying at the trade level—this is a bearish/contrarian signal that should be watched.
Regarding reference levels: for the long side, start with 0.0367 - 0.03907; it is more suitable to wait for confirmation after a pullback and absorption.
If price pulls back into this range and then shows signs of stabilization, the long-biased thesis can remain valid.
Set the invalidation level at 0.03619. If price breaks below this, it means the current upward structure is broken, the long thesis fails, and it should not be treated as valid under the original thesis.
For upside extension, watch 0.043. If volume continues to expand, then look around 0.04654 for resistance. Once price hits the resistance zone, you should reassess whether the momentum can continue.
The reference risk-reward ratio is about 1.4—only for structural reference.
The active buy/sell ratio of 0.98 shows the buy side is not currently dominant. If active buying remains weak afterward, price may keep oscillating repeatedly within the focus zone, and could even test the invalidation reference level. This should not be overlooked just because the market is rising.
Under contract leverage, position discipline is more important than directional guess.
Position note: This account holds a long position of $FOGO in live trading. Continue holding as long as the logic is not broken.
For reference only and does not constitute investment advice. Contracts involve leverage; investing is risky.
This article was generated with the assistance of an OpenAI large model.
$POLYX
#Futures contract analysis