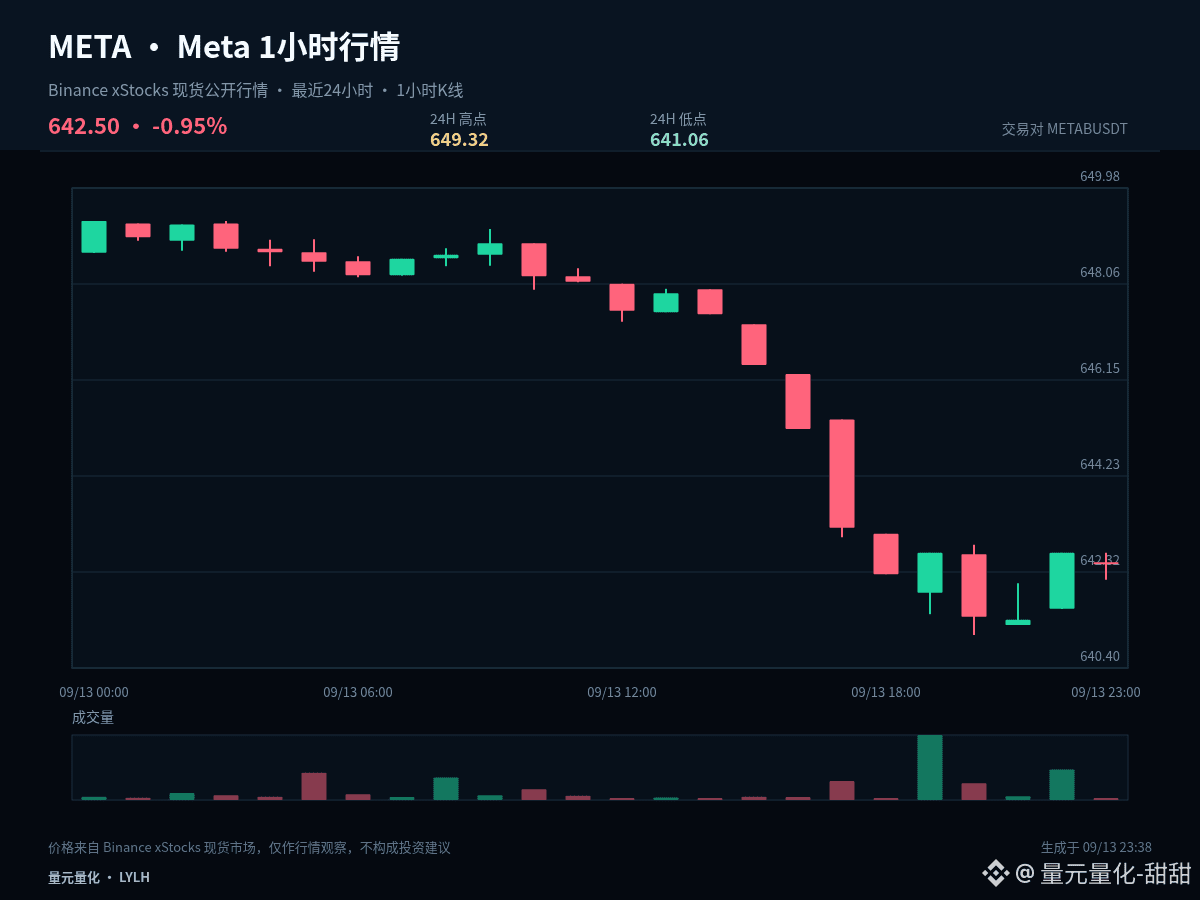
$METAB #META This time, I’ll break it down from a position perspective. The same chart shows different key points depending on whether you’re already in a position or currently in cash. Current price: 642.5. 1-hour: -0.03%. 24-hour: -1.00%.
The current price is near the lower end of the last 24-hour range: 1-hour -0.03%, 24-hour -1.00%. The core of downside analysis isn’t predicting a bottom too early—it’s watching whether, after a breakdown, price can quickly reclaim. If it reclaims, that indicates sell pressure has been absorbed. If it continues to linger below the lower end, it means weakness hasn’t truly ended yet.
For holders with an existing position: watch whether 641.06 is lost. If it is lost, reduce risk exposure first. For those in cash: wait until the low stops making new lows, and confirm that price has returned above 645.19—don’t catch the falling structure too early.
My scenario planning isn’t betting on only one direction. A breakout above 649.32 and holding it means upside space has been reopened. A drop below 641.06 and a failure to reclaim it means the structure weakens further. If price keeps ranging between the two, continue observing how closes behave on both sides around 645.19.
Position management should distinguish between mid-term and short-term. For existing mid-term positions, first check whether the structure is broken; don’t be repeatedly shaken by single 1-hour candlesticks. For short-term positions, execute around support, resistance, and confirmed closes. People in cash don’t need to chase price in the middle of the range—waiting for clearer locations usually offers an advantage.
Risk control remains before the conclusion: only act when conditions are met, and re-evaluate promptly if the price becomes invalid. The higher the volatility, the more you should be restrained with each position. The above is scenario analysis based on current 1-hour and 24-hour data and does not constitute a promise of returns.
#CanadaOSFISaysTokenizedDepositsEqualTraditionalDeposits
The current price is near the lower end of the last 24-hour range: 1-hour -0.03%, 24-hour -1.00%. The core of downside analysis isn’t predicting a bottom too early—it’s watching whether, after a breakdown, price can quickly reclaim. If it reclaims, that indicates sell pressure has been absorbed. If it continues to linger below the lower end, it means weakness hasn’t truly ended yet.
For holders with an existing position: watch whether 641.06 is lost. If it is lost, reduce risk exposure first. For those in cash: wait until the low stops making new lows, and confirm that price has returned above 645.19—don’t catch the falling structure too early.
My scenario planning isn’t betting on only one direction. A breakout above 649.32 and holding it means upside space has been reopened. A drop below 641.06 and a failure to reclaim it means the structure weakens further. If price keeps ranging between the two, continue observing how closes behave on both sides around 645.19.
Position management should distinguish between mid-term and short-term. For existing mid-term positions, first check whether the structure is broken; don’t be repeatedly shaken by single 1-hour candlesticks. For short-term positions, execute around support, resistance, and confirmed closes. People in cash don’t need to chase price in the middle of the range—waiting for clearer locations usually offers an advantage.
Risk control remains before the conclusion: only act when conditions are met, and re-evaluate promptly if the price becomes invalid. The higher the volatility, the more you should be restrained with each position. The above is scenario analysis based on current 1-hour and 24-hour data and does not constitute a promise of returns.
#CanadaOSFISaysTokenizedDepositsEqualTraditionalDeposits