

Daily sharing
BTC 57,800~82,300 is a rebound at the daily-chart level. It took 64 days and is basically over. There hasn’t been a market that keeps rising continuously—so wait patiently for the daily-chart level decline to play out. How low can the daily-chart decline go? Since BTC has never broken above 82,850, in my view, the probability of making new lows and breaking below 57,800 remains high.
Market mood: The CPI on the 11th met expectations, but it didn’t ease, which suggests inflation itself is somewhat stubborn and hasn’t been relieved. But after the CPI data came out, the market quickly rebounded for a round. In that move, there’s likely a larger component of luring and liquidating leverage. After the price spiked to 79,800, it has now fallen back to below 77,000, indicating that the market doesn’t have any real positive catalyst to push prices to higher space.
As for the next news-driven factor, one is a clear procedural vote in the Senate. It needs 60 votes to pass. At the moment, the market generally believes that it will be difficult to obtain 60 votes for the vote on the 15th during Eastern Time. However, the probability that it will eventually pass is still relatively high. For now, it is not yet clear how strongly this news will affect BTC. Personally, I think it will not cause too much volatility in the short term. Even if it passes, it is not the final vote; it doesn’t mean the bill will take effect immediately. After that, there will still be full-chamber votes, coordination between the two chambers’ texts, the President’s signing, and other steps.
Another news factor is the Fed FOMC interest rate decision meeting at 2:00 AM Beijing time on the 17th. At the moment, it is hard to say whether there will be a rate hike on the 17th; the market expectation is that the probability of a hike is relatively high. But a rate hike does not necessarily mean BTC will immediately plunge hard. Not a rate hike does not necessarily mean BTC will directly take off and hit new all-time highs. This will also depend on the interest-rate dot plot and some expectations mentioned during the press conference.
From a technical perspective, the probability that the overall 82300 has topped on a short-term basis is still very high. The appearance of news could either accelerate the sell-off speed or make the short-term decline unusually complex and choppy, with frequent back-and-forth sharp wicks.
Mid-to-short-term trend direction
4h cycle main direction: Most likely a 4h-level decline in the short term.
1h cycle direction: For now, it is not clear whether there will be a 1h-level rebound.
BTC短线
Because market conditions change quickly in the short term, this article can only make a prediction about the行情 change at the moment it is published. Short-term traders should pay attention to the latest changes in行情; this should be used only as a reference.
1H:
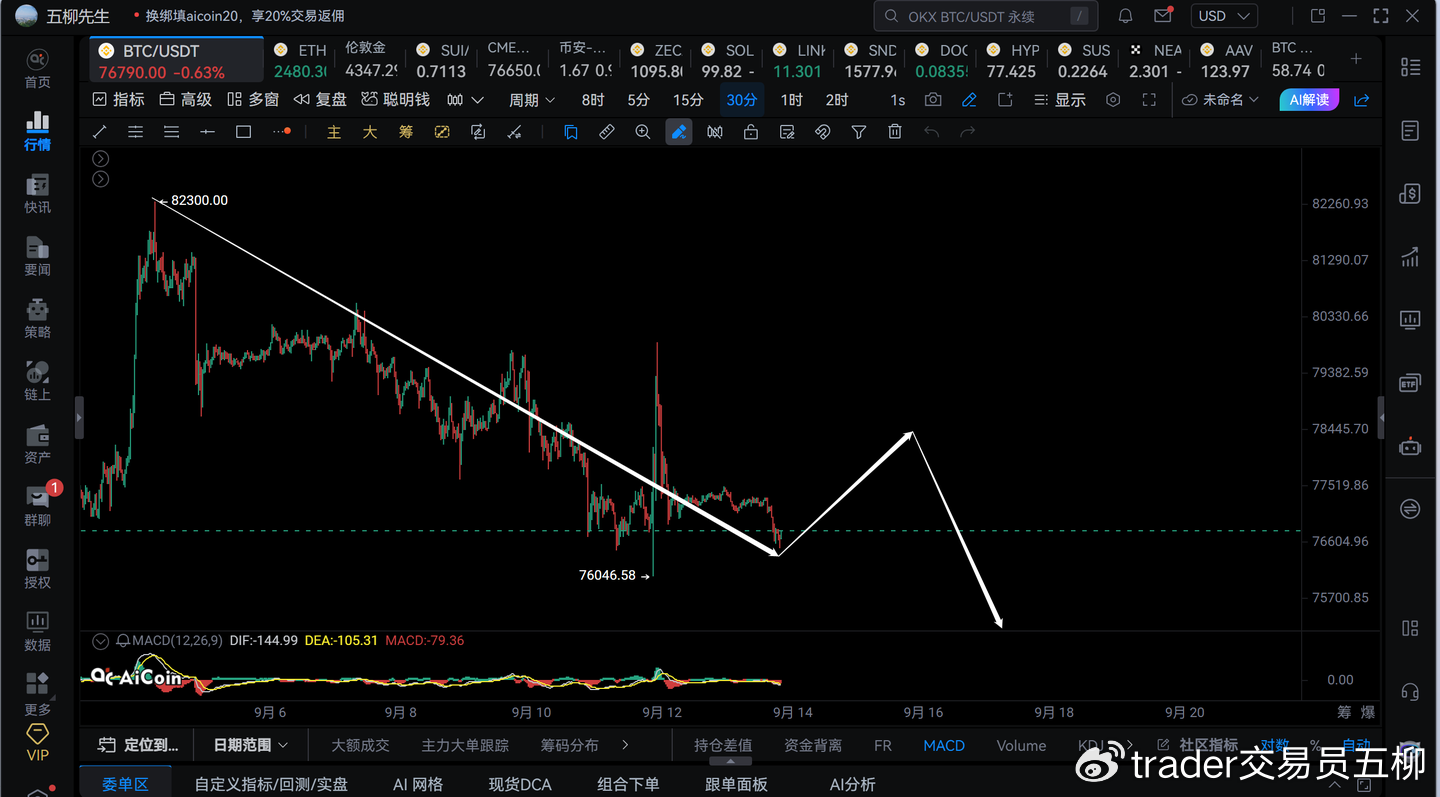
1) In the short term, due to the effect of the CPI release causing upside-and-downside wick spikes, the difficulty of defining the structure is relatively high, and for now it is still not clear which structure is more reasonable.
2) If BTC on the short term does not keep falling below 76500 tonight, or does not break below 76000, then treating 82300~76500 as a single 1h-level decline is more reasonable. In that case, tomorrow could see a 1h-level rebound. If the rebound happens, watch the 78000~79000 range. After that, there will be a third 1h-level decline.
3) If later tonight it still breaks below 76000, it may continue to slump in a choppy way down toward around 74000, and then produce a 1h rebound.
4) Where the overall first 4h-level decline can go still needs further observation. The key is 72000—only if it breaks below will the sell-off accelerate.
15M:
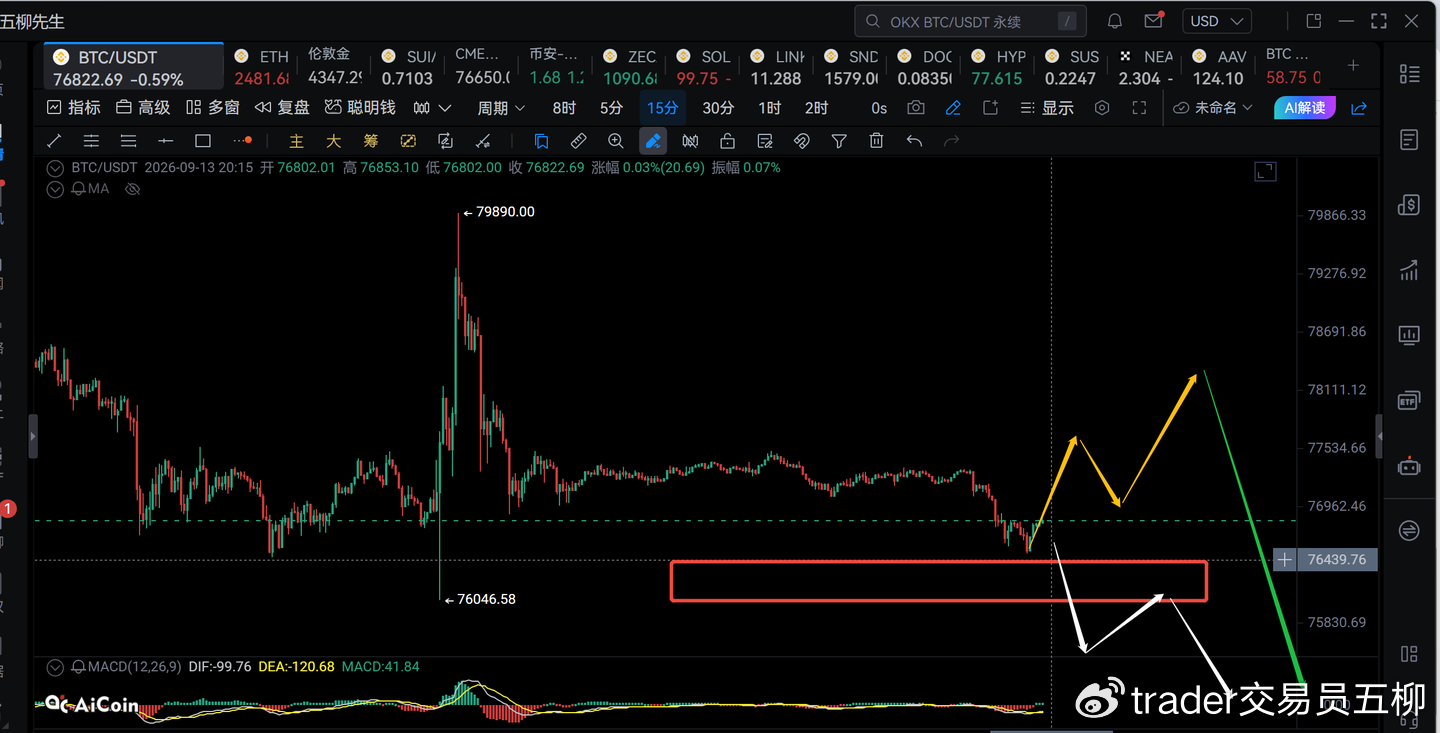
1) On the 15-minute timeframe, the recent short-term structure is relatively messy. First, observe support in the 76000~76500 area. If it does not break below 76000, then here it should produce a rebound at the 1h level, reaching above 78000.
2) The wick-pin at 79890 on Friday is unlikely to be revisited. If there is a short-term rebound, it should still be within the 78000~79000 range.
3) A renewed break above 77350 can confirm that this is unfolding as a rebound of the 1h level.
4) If it breaks below 76000, it should continue to trade lower in a range down to 75000~74000.
ETH
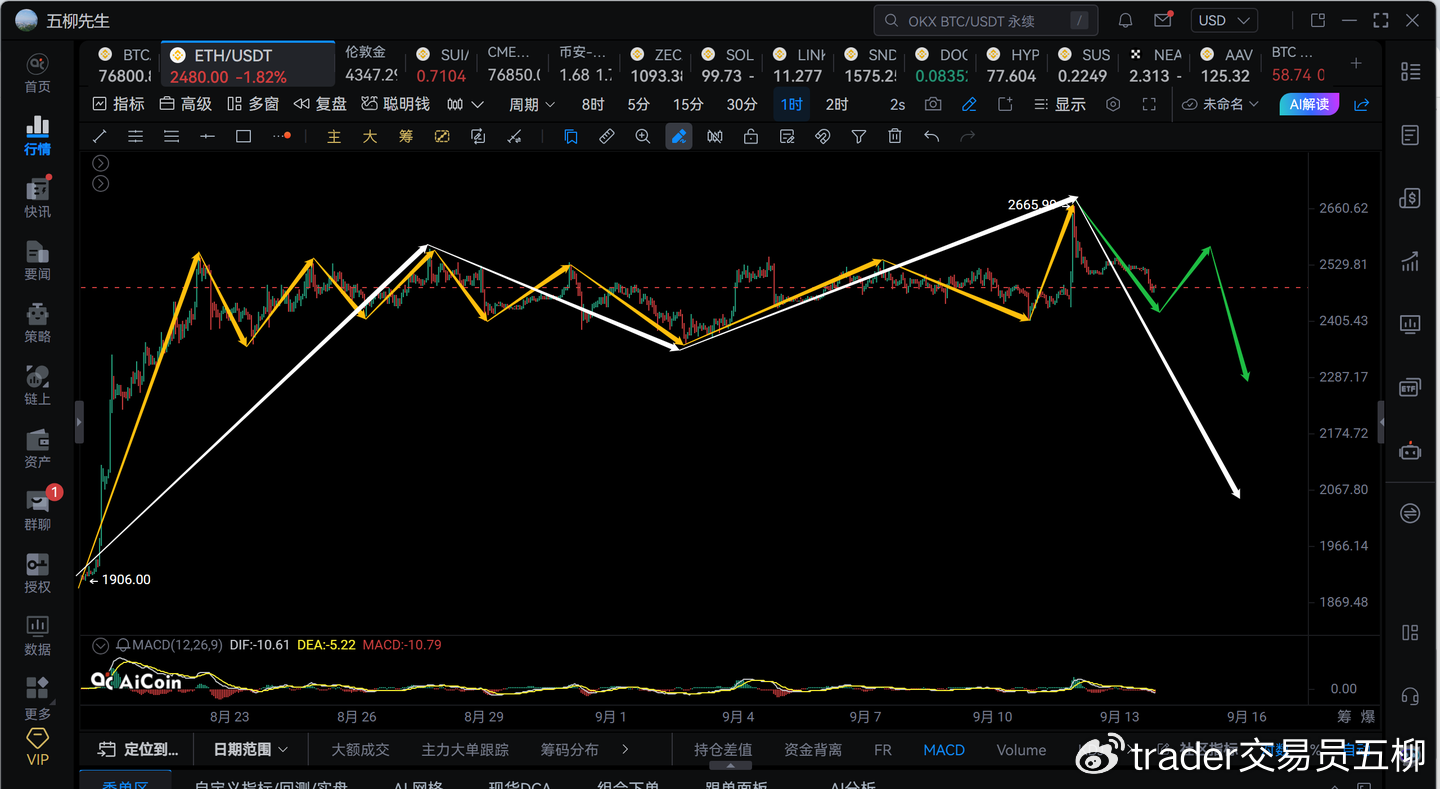
1) The yellow arrows in the image indicate the structure at the 1h level; the white arrows indicate the structure at the 4h level; the green arrows indicate the 1h-level structure after the top. From the chart, we can see that Ethereum has already formed the 5th 4h-level rebound starting from 1512.
1512~1981 is the 1st 4h-level rebound.
1981~1822 is the 2nd 4h-level pullback.
1822~2566 is the 3rd 4h-level rebound.
2566~2356 is the 4th 4h-level pullback.
2356~2665 is the 5th 4h-level rebound.
Currently, the 5th rebound on the 4h level has already shown divergence, and at the same time the price has broken below 2500. From a technical standpoint, Ethereum is likely to enter a new 4h-level decline next, and this 4h-level drop will at minimum fall to after September 18.
2) If the 4h-level decline breaks below 2350, it basically declares that the daily-level rebound that started from 1512~2665 has come to an end. The daily rebound took 77 days—so it could also be considered close to ending.
3) Since the daily chart has broken out above 2622, the next daily-level pullback for Ethereum has a high probability of not falling below 1500. It might replicate the bear-market行情 from 2022, with an early bottom forming. Where the daily pullback can reach—let’s observe again once it officially breaks below 2350.
4) For now, let’s first look for a 4h-level decline. It should currently be in the process of the first 1h-level decline. For now, it is still not certain whether this 1h-level decline has ended.
5) If on the short term it does not break below 2435, there is still a chance to see a 1h-level rebound reaching the 2550~2600 area, producing a “second sell” on the 4h level along the way.
6) Next week, it is very likely to break below 2350, to confirm the daily-level decline.
7) Given Ethereum’s strong momentum, next year it could see the next rebound at the weekly level. There is a chance that Ethereum in summer may break through the 5000 level, provided that the next daily-level pullback for Ethereum does not fall below 1500 again.