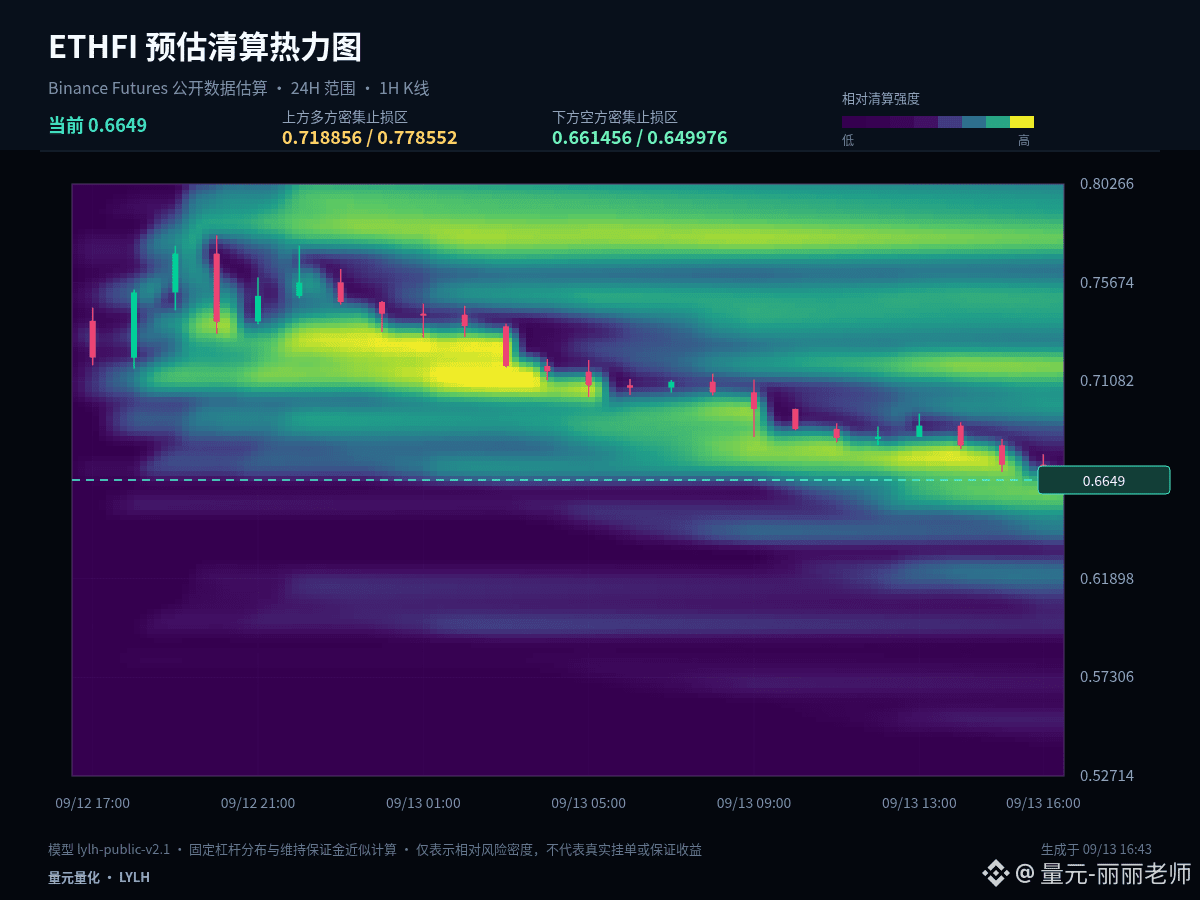
$ETHFI #ETHFI From a layout perspective, the key is not chasing fluctuations that have already occurred, but determining in advance where you are willing to wait. Current price 0.666, 1 hour -1.03%, 24 hours -10.6%。
The current price is close to the lower bound of the past 24-hour range. The core of analyzing the low is not prematurely bottom-picking, but observing whether price can quickly reclaim after a breakdown. If it can reclaim, it indicates that selling pressure has been absorbed; if it continues to linger below the lower bound, it suggests that weakness has not ended.
The first observation zone is 0.72215, used to judge whether a normal pullback has ended. The second observation zone is 0.665, used to determine whether a deeper retracement can form support. On the upside, focus on 0.7793: after a breakout, you should look for a pullback confirmation to avoid mistaking a brief wick through for the trend being fully opened.
For those who already hold positions, the focus is to manage based on whether support has failed, rather than being carried along by every fluctuation. For those with no position, prioritize waiting for a breakout + pullback, or support confirmation. For spot trading, you can scale in batches; for futures, you should shorten the decision chain—first determine the stop-loss level, then decide whether to participate.
The meaning of scaling in is not to constantly lower the average cost, but to control the pace while the structure remains valid. Once key support fails, you should stop the original layout plan and wait for a new price range to form.
Risk control is still placed before the conclusion: execute only when conditions appear, and reassess promptly if the price invalidates. The greater the volatility, the more restraint you should show with any single position. The above is a scenario analysis based on the current 1-hour and 24-hour data, and does not constitute a promise of returns.
#SECReceivesGrayscaleLitecoinTrustETFFiling
The current price is close to the lower bound of the past 24-hour range. The core of analyzing the low is not prematurely bottom-picking, but observing whether price can quickly reclaim after a breakdown. If it can reclaim, it indicates that selling pressure has been absorbed; if it continues to linger below the lower bound, it suggests that weakness has not ended.
The first observation zone is 0.72215, used to judge whether a normal pullback has ended. The second observation zone is 0.665, used to determine whether a deeper retracement can form support. On the upside, focus on 0.7793: after a breakout, you should look for a pullback confirmation to avoid mistaking a brief wick through for the trend being fully opened.
For those who already hold positions, the focus is to manage based on whether support has failed, rather than being carried along by every fluctuation. For those with no position, prioritize waiting for a breakout + pullback, or support confirmation. For spot trading, you can scale in batches; for futures, you should shorten the decision chain—first determine the stop-loss level, then decide whether to participate.
The meaning of scaling in is not to constantly lower the average cost, but to control the pace while the structure remains valid. Once key support fails, you should stop the original layout plan and wait for a new price range to form.
Risk control is still placed before the conclusion: execute only when conditions appear, and reassess promptly if the price invalidates. The greater the volatility, the more restraint you should show with any single position. The above is a scenario analysis based on the current 1-hour and 24-hour data, and does not constitute a promise of returns.
#SECReceivesGrayscaleLitecoinTrustETFFiling