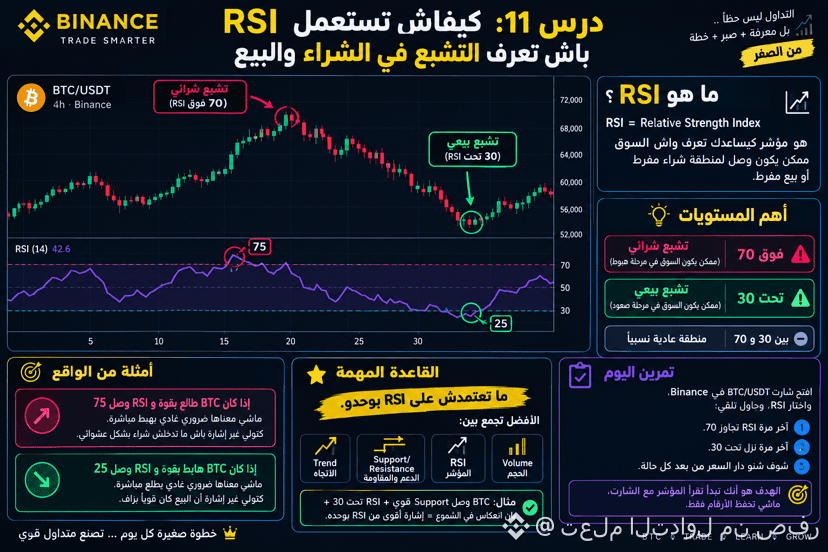
� Lesson 11: How to use RSI to spot overbought and oversold
RSI = Relative Strength Index
It’s an indicator that helps you understand whether the market has reached an overbought (buy) or oversold (sell) area.
🔹 Key Levels
* RSI above 70 → the market may be overbought ⚠️
* RSI below 30 → the market may be oversold ⚠️
* RSI between 30 and 70 → relatively normal zone.
🧠 Example with Bitcoin
If BTC is rising strongly and RSI reaches 75, it doesn’t necessarily mean Bitcoin will drop immediately. It just gives you a signal so you don’t enter a buy randomly.
And if BTC is falling strongly and RSI reaches 25, it doesn’t necessarily mean it will rise immediately. It only tells you that the selling was very strong.
⭐ Important Rule
Don’t rely on RSI by itself.
The best approach is to combine:
Trend + Support/Resistance + RSI + Volume
For example:
BTC hits a strong Support + RSI below 30 + candlestick reversal = a stronger signal than RSI alone. 📊
🎯 Today’s Exercise
Open the BTC/USDT chart on Binance, choose RSI, and try to find:
1. The last time RSI went above 70.
2. The last time it dropped below 30.
3. See what the price did after each case.
The goal is that you start reading the indicator with the chart, not just memorizing numbers
#EtherRalliesAsBearishBetsLiquidate #ClarityActFacesProceduralVoteSept15 #BTC #cryptouniverseofficial #USDTfree
$USDT $BTC $GOOGL.US
RSI = Relative Strength Index
It’s an indicator that helps you understand whether the market has reached an overbought (buy) or oversold (sell) area.
🔹 Key Levels
* RSI above 70 → the market may be overbought ⚠️
* RSI below 30 → the market may be oversold ⚠️
* RSI between 30 and 70 → relatively normal zone.
🧠 Example with Bitcoin
If BTC is rising strongly and RSI reaches 75, it doesn’t necessarily mean Bitcoin will drop immediately. It just gives you a signal so you don’t enter a buy randomly.
And if BTC is falling strongly and RSI reaches 25, it doesn’t necessarily mean it will rise immediately. It only tells you that the selling was very strong.
⭐ Important Rule
Don’t rely on RSI by itself.
The best approach is to combine:
Trend + Support/Resistance + RSI + Volume
For example:
BTC hits a strong Support + RSI below 30 + candlestick reversal = a stronger signal than RSI alone. 📊
🎯 Today’s Exercise
Open the BTC/USDT chart on Binance, choose RSI, and try to find:
1. The last time RSI went above 70.
2. The last time it dropped below 30.
3. See what the price did after each case.
The goal is that you start reading the indicator with the chart, not just memorizing numbers
#EtherRalliesAsBearishBetsLiquidate #ClarityActFacesProceduralVoteSept15 #BTC #cryptouniverseofficial #USDTfree
$USDT $BTC $GOOGL.US