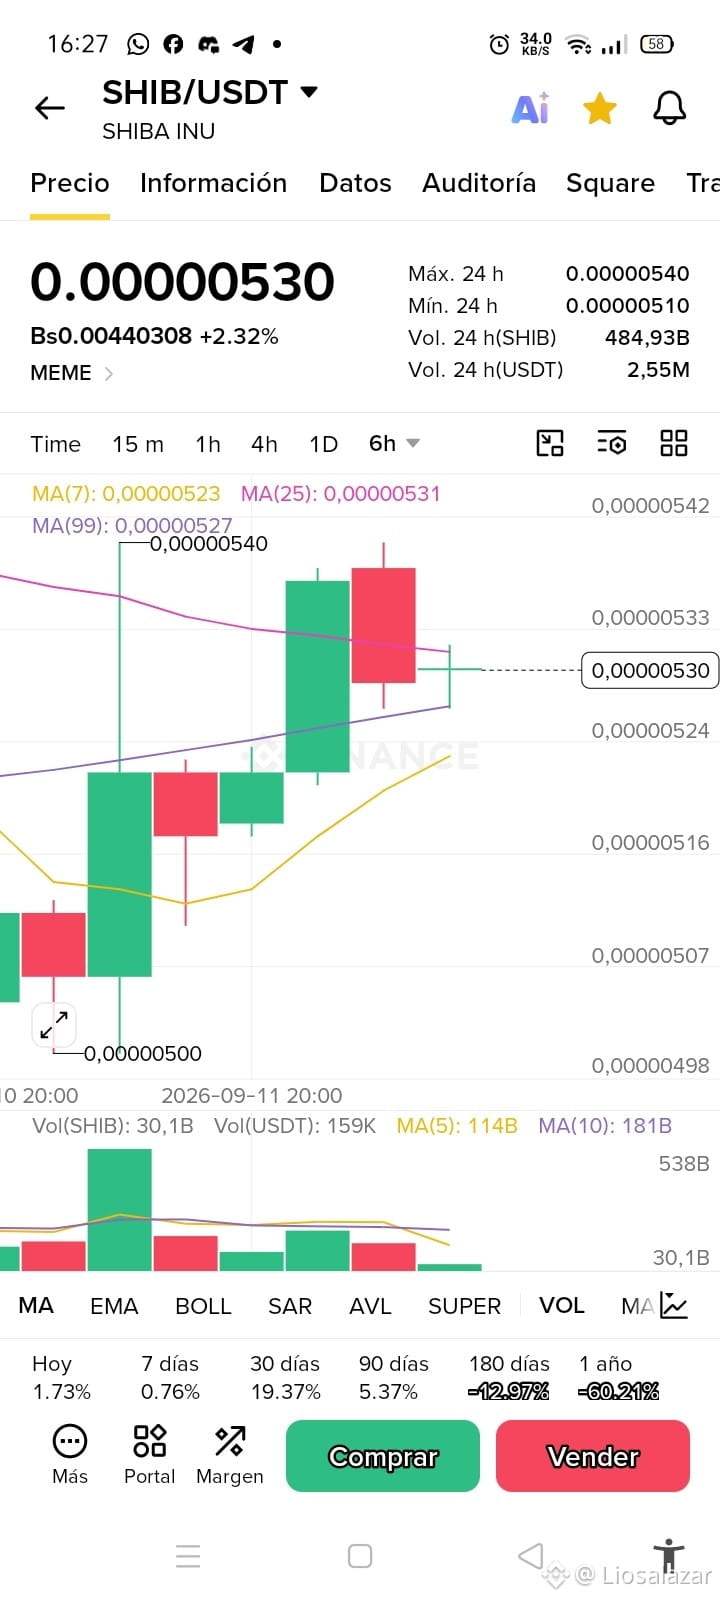
Technical Analysis SHIB/USDT (Spot) — 6h Timeframe 📊
Technical analysis of the price structure for SHIBA INU after testing key resistances on the chart.
Metrics and Key Data:
Trading pair: SHIB/USDT Spot
Current price: 0.00000530 USDT (+2.32%)
24h high: 0.00000540 USDT
24h low: 0.00000510 USDT
24h Volume (SHIB): 484.93B
Moving Averages (MA): MA(7) = 0.00000523 | MA(25) = 0.00000531 | MA(99) = 0.00000527
Chart Reading:
Breakthrough Attempt: After a bullish impulse from the floor at 0.00000500 USDT, the price reached the recent high at 0.00000540 USDT, where it met an immediate rejection.
Moving Average Compression: The price trades right around the MA(25) ($0.00000531) and the MA(99) ($0.00000527), showing compression in the middle of the range.
Immediate Dynamic Support: The MA(7) at 0.00000523 USDT acts as the first short-term support to sustain the local bullish bias.
Do you think $SHIB will break the resistance at $0.00000540 to extend the move or will it consolidate again near support at $0.00000520? 💬👇
SHIBUSDT
Technical analysis of the price structure for SHIBA INU after testing key resistances on the chart.
Metrics and Key Data:
Trading pair: SHIB/USDT Spot
Current price: 0.00000530 USDT (+2.32%)
24h high: 0.00000540 USDT
24h low: 0.00000510 USDT
24h Volume (SHIB): 484.93B
Moving Averages (MA): MA(7) = 0.00000523 | MA(25) = 0.00000531 | MA(99) = 0.00000527
Chart Reading:
Breakthrough Attempt: After a bullish impulse from the floor at 0.00000500 USDT, the price reached the recent high at 0.00000540 USDT, where it met an immediate rejection.
Moving Average Compression: The price trades right around the MA(25) ($0.00000531) and the MA(99) ($0.00000527), showing compression in the middle of the range.
Immediate Dynamic Support: The MA(7) at 0.00000523 USDT acts as the first short-term support to sustain the local bullish bias.
Do you think $SHIB will break the resistance at $0.00000540 to extend the move or will it consolidate again near support at $0.00000520? 💬👇
SHIBUSDT