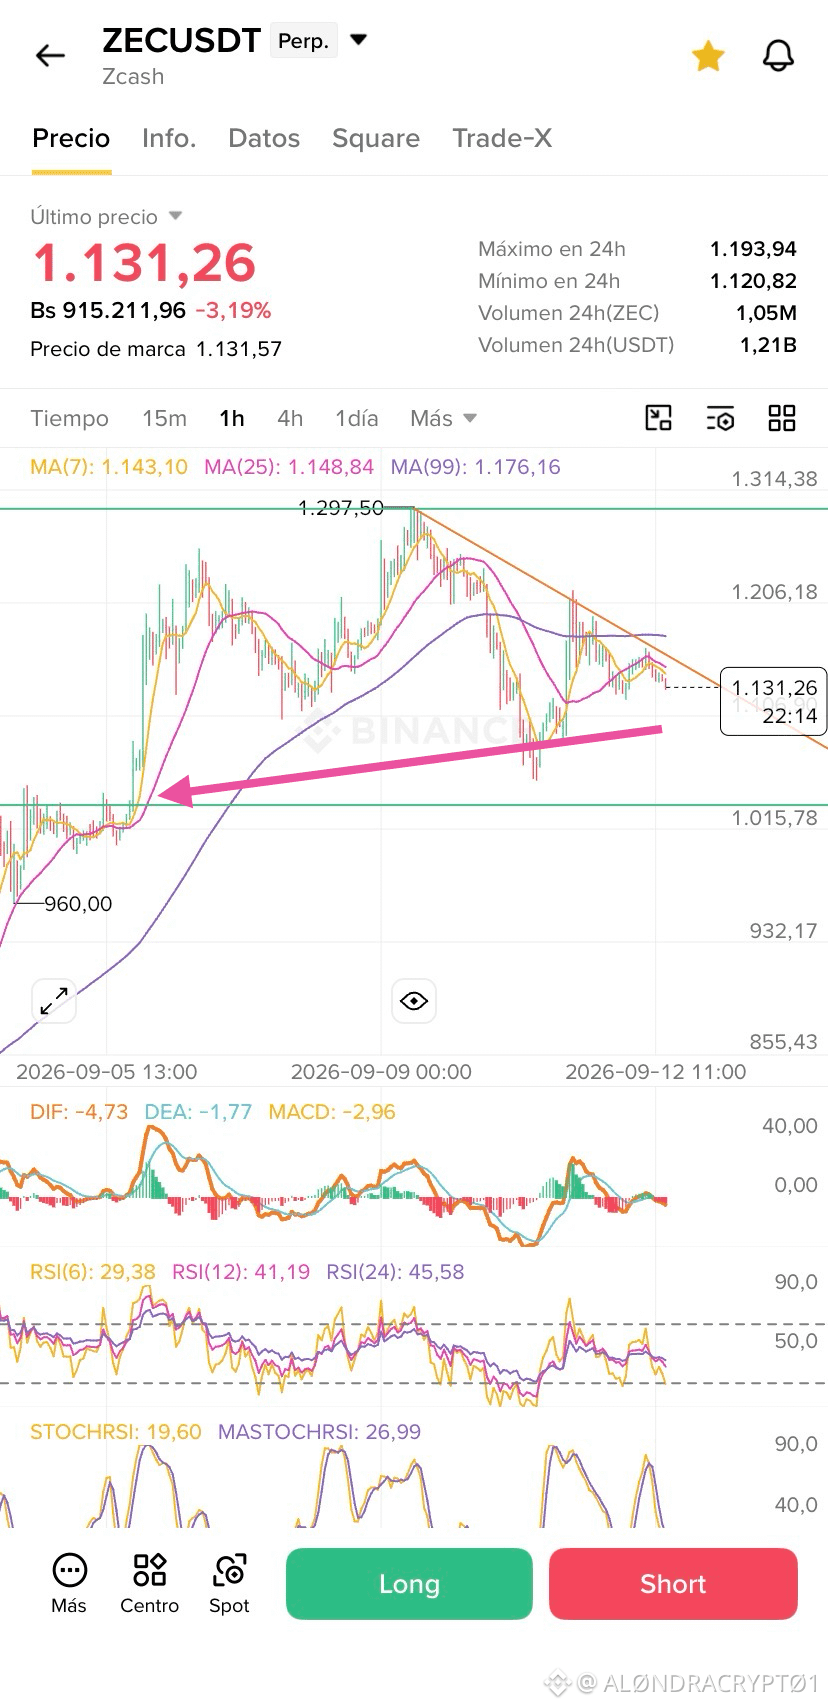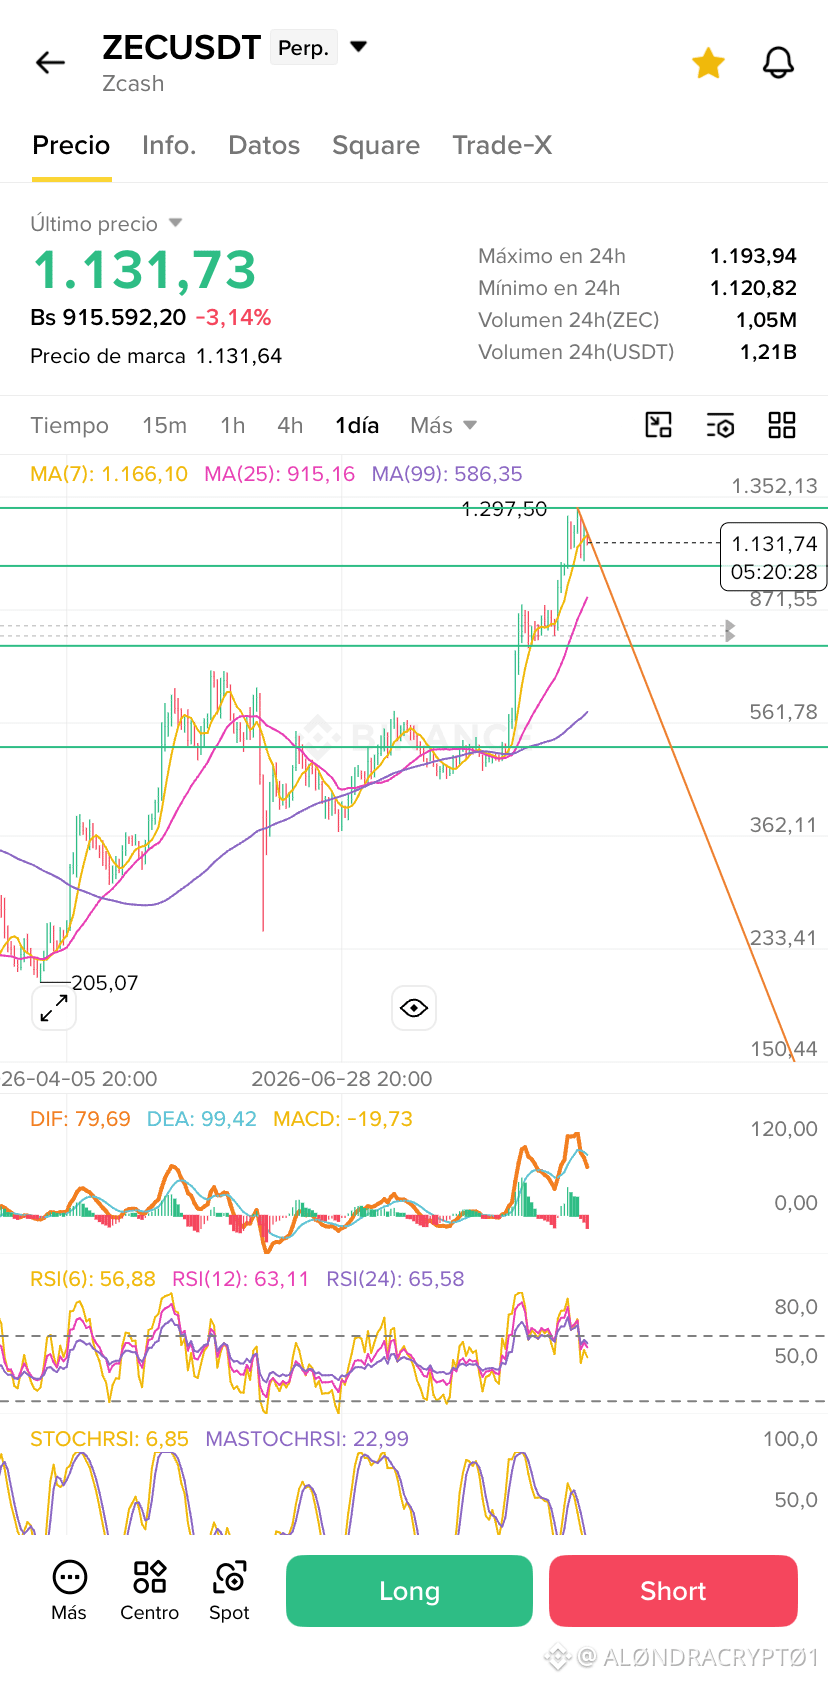

Look at the chart of $ZEC . In the one-hour chart, the price is moving downward toward the previous support zone near 1.015, right where the pink arrow points to search for liquidity, while in the one-day chart the Stochastic RSI is already at the bottom.
Do you expect the bounce, or are you watching from the outside?
TOUCH HERE ⬇️⬇️
Do you expect the bounce, or are you watching from the outside?
TOUCH HERE ⬇️⬇️