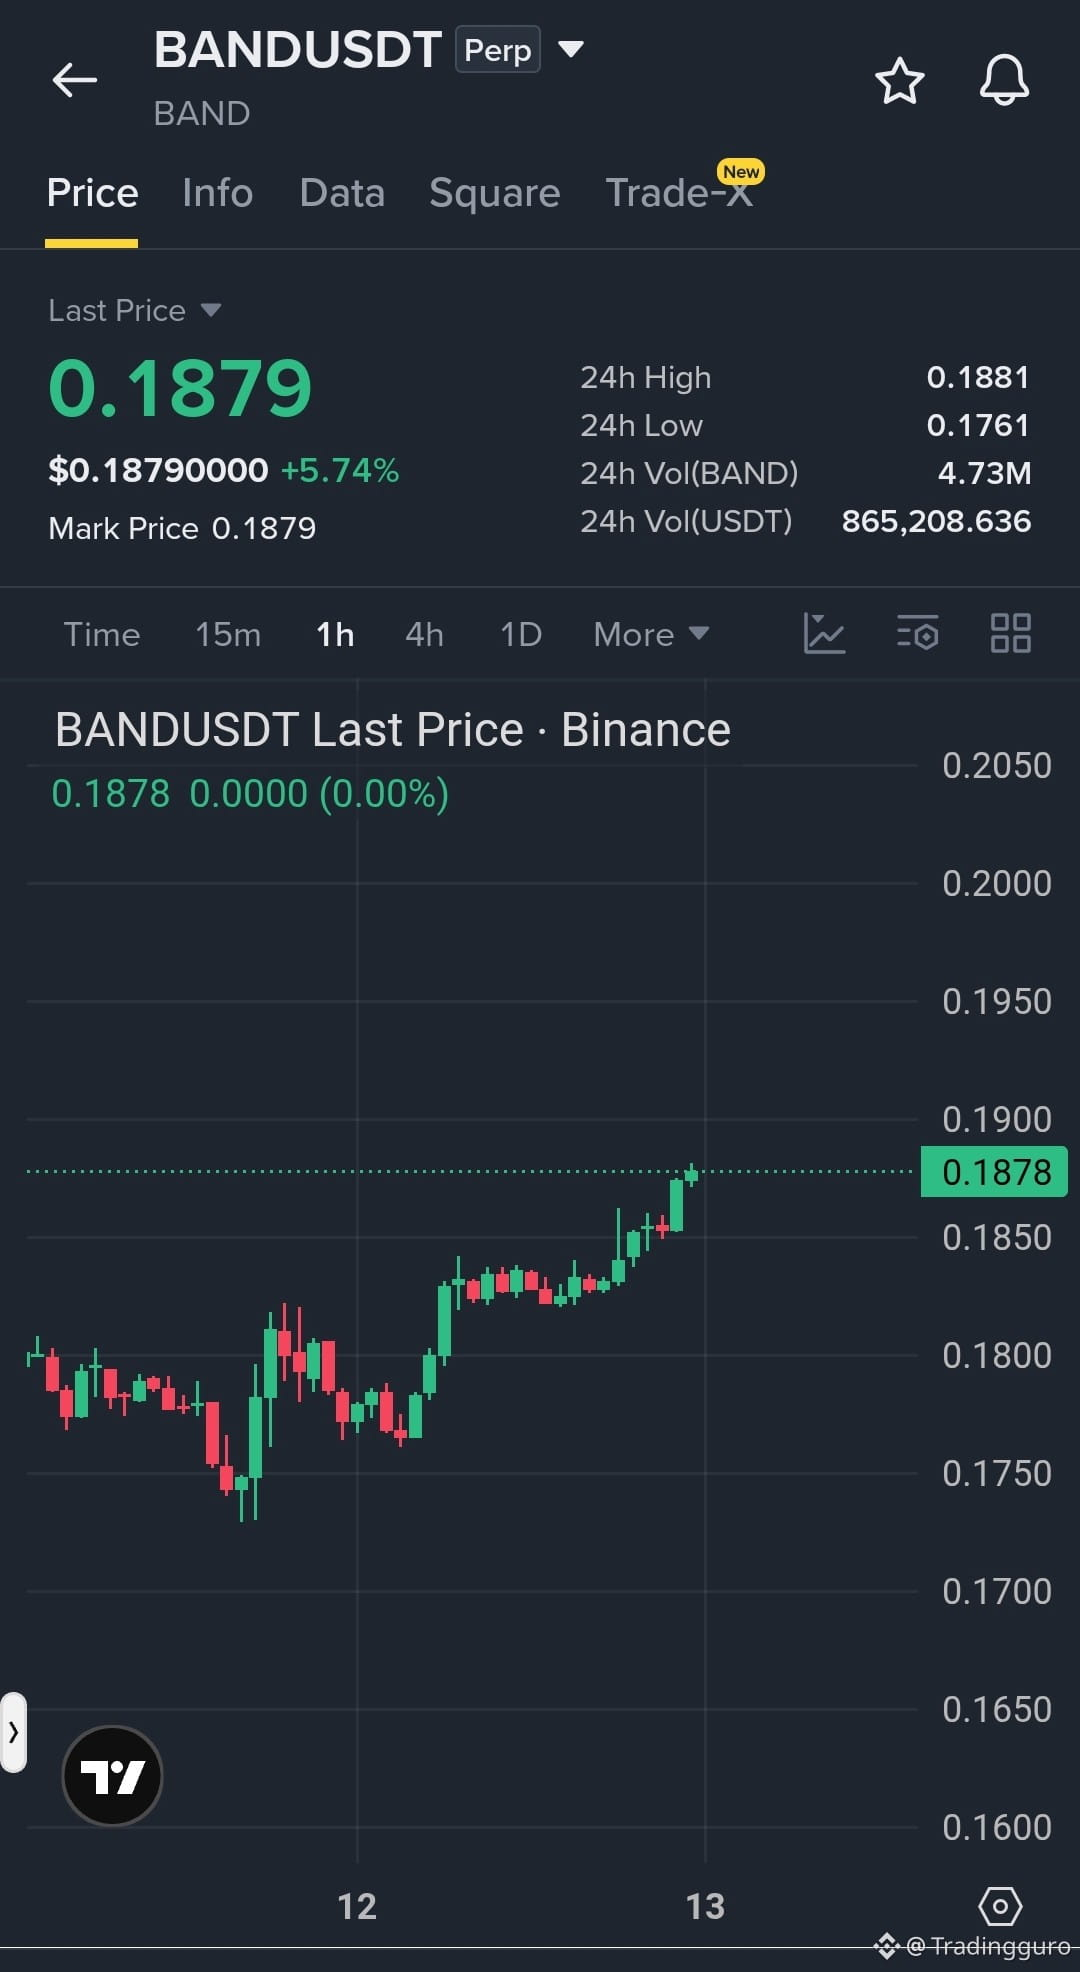

$BAND /USDT - Trade Setup
LONG SCENARIO
Entry: 0.1840 – 0.1870
SL: 0.1780
TP: 0.1920 / 0.1980 / 0.2050
Chart Analysis:
BAND/USDT is showing a positive recovery structure on the 1H timeframe. The chart has formed a strong rebound from the lower support zone and is now printing higher highs and higher lows. Recent bullish candles indicate increasing buying pressure, with price moving toward the resistance area around 0.1880. The consolidation breakout suggests buyers are attempting to take control and continue the upward move.
Next Move:
If BAND holds above the 0.1840 support zone, bullish momentum can continue toward 0.1920 and higher resistance levels. A clean breakout above 0.1880 with volume confirmation may accelerate the next leg upward.
Trade
$NVDA.US $NVDAB
LONG SCENARIO
Entry: 0.1840 – 0.1870
SL: 0.1780
TP: 0.1920 / 0.1980 / 0.2050
Chart Analysis:
BAND/USDT is showing a positive recovery structure on the 1H timeframe. The chart has formed a strong rebound from the lower support zone and is now printing higher highs and higher lows. Recent bullish candles indicate increasing buying pressure, with price moving toward the resistance area around 0.1880. The consolidation breakout suggests buyers are attempting to take control and continue the upward move.
Next Move:
If BAND holds above the 0.1840 support zone, bullish momentum can continue toward 0.1920 and higher resistance levels. A clean breakout above 0.1880 with volume confirmation may accelerate the next leg upward.
Trade
$NVDA.US $NVDAB