Trading Plan | 9/13 02:21
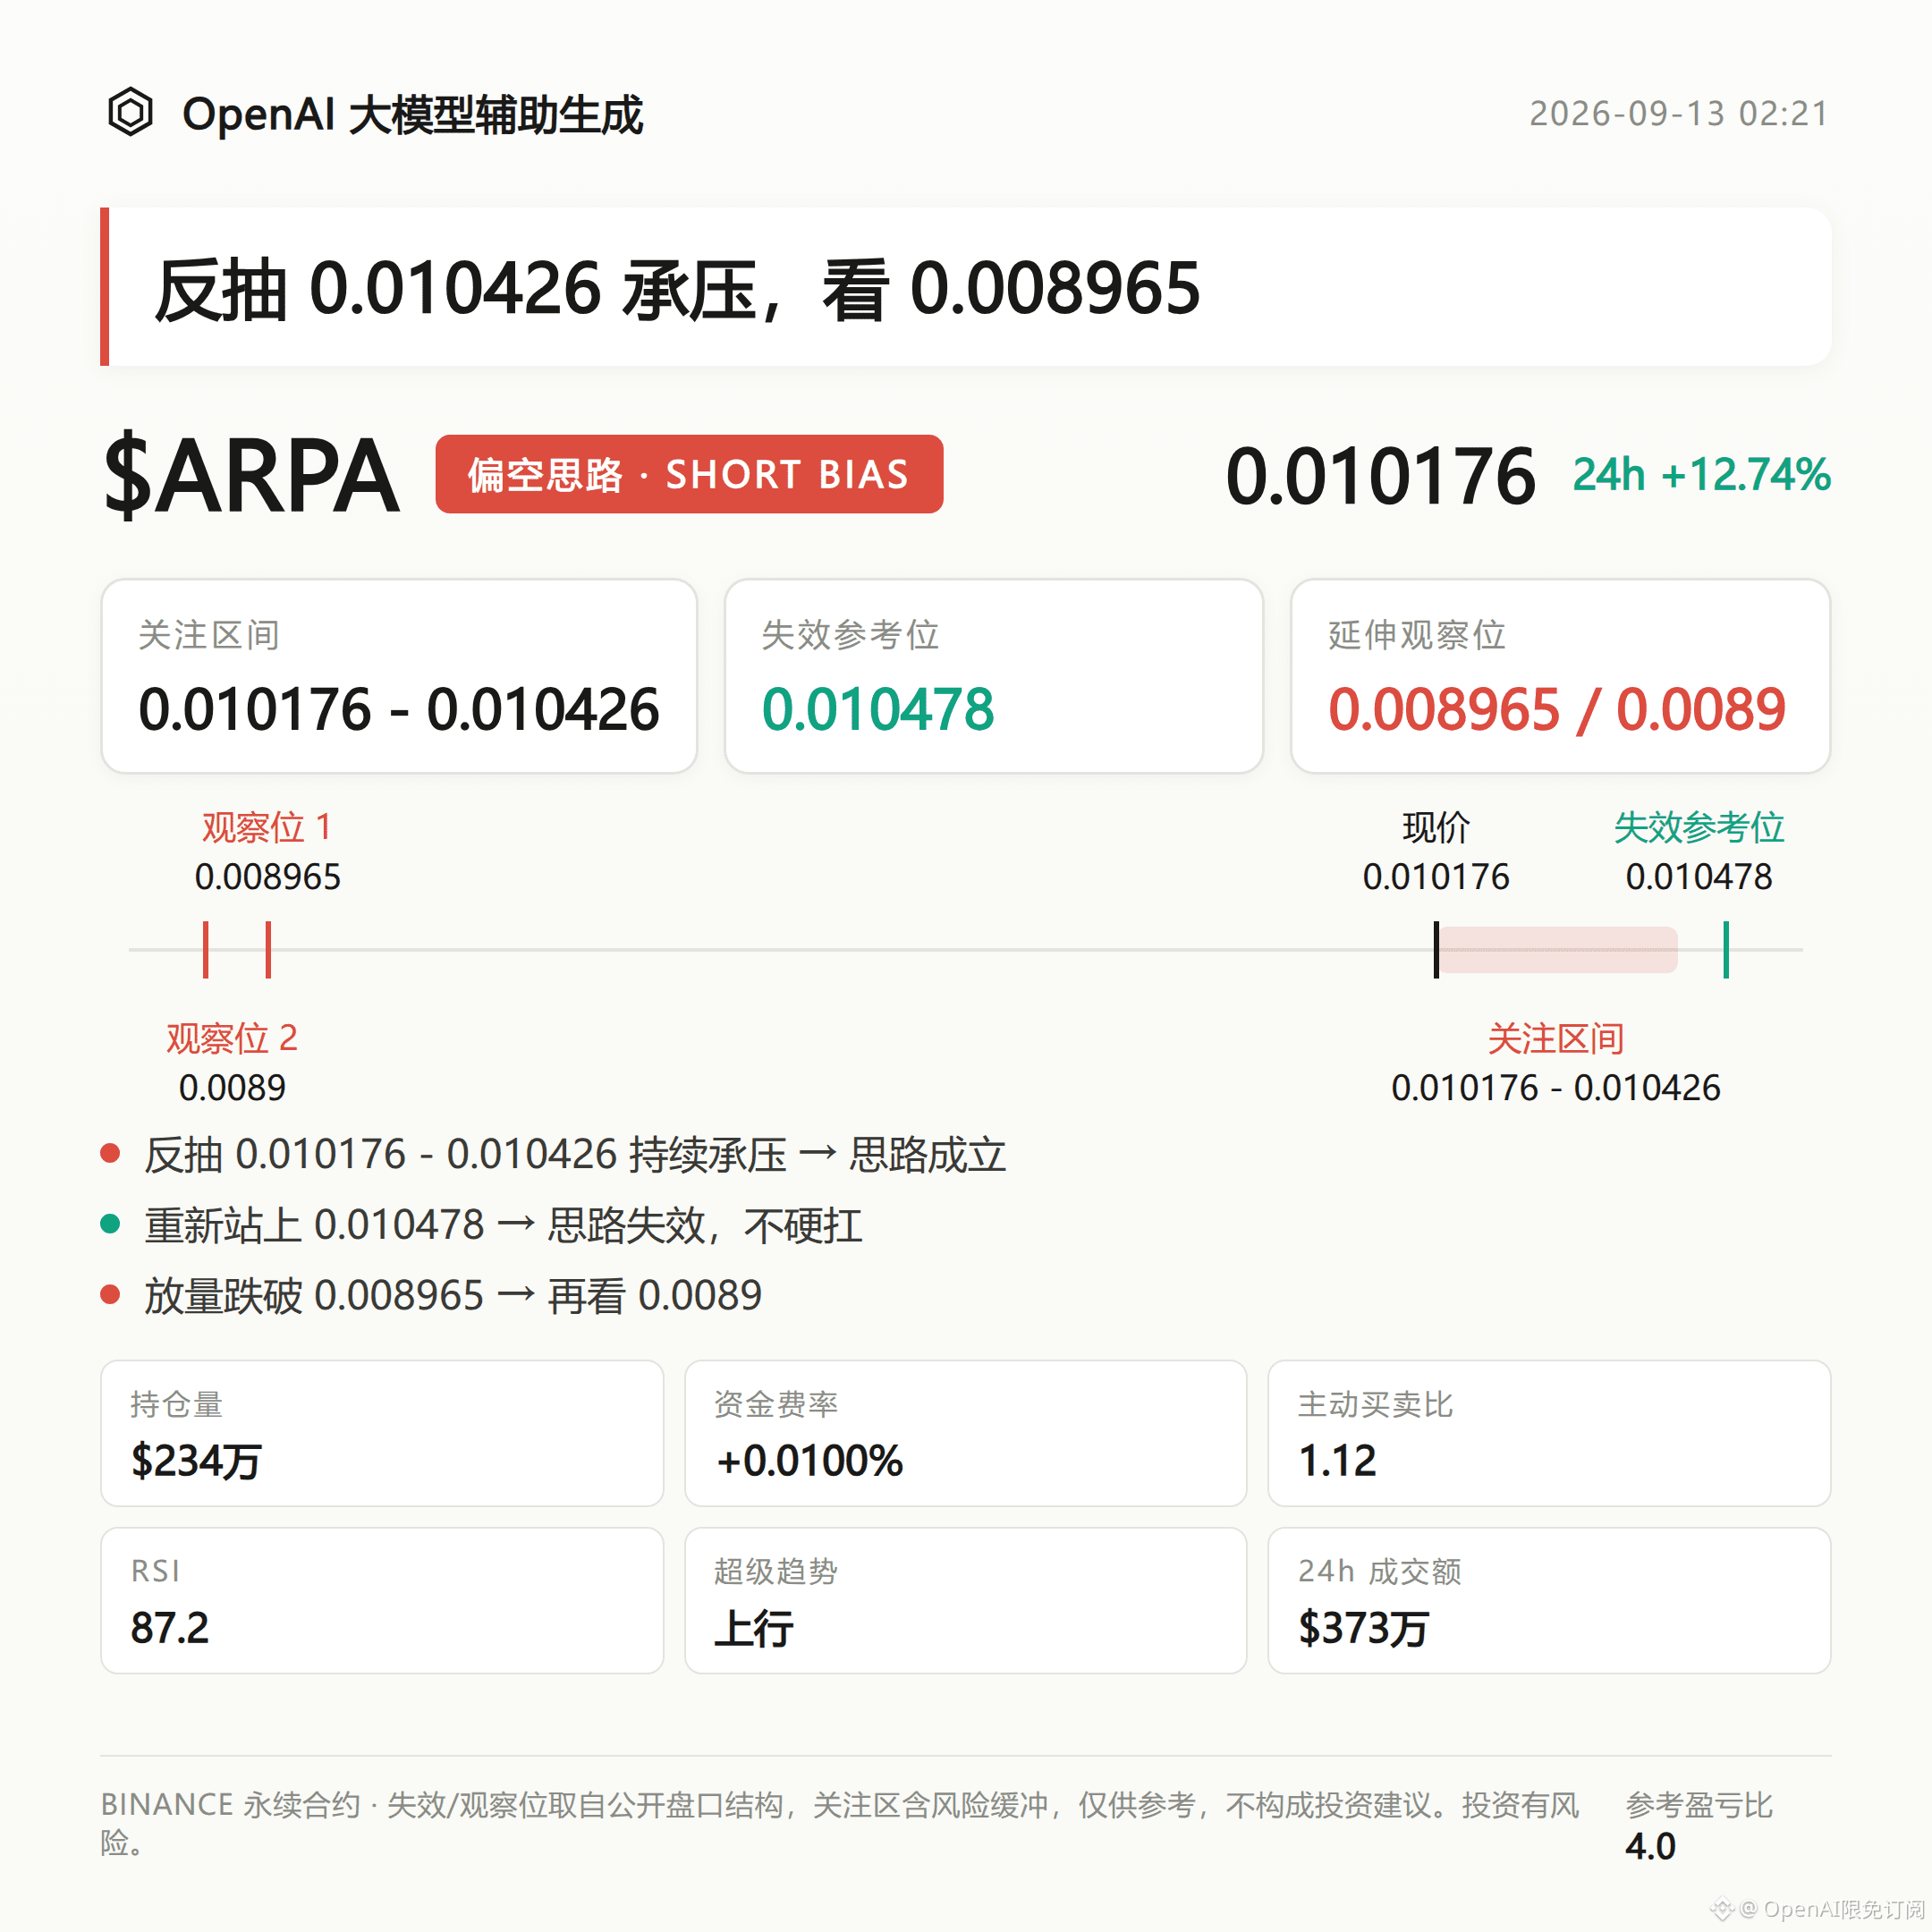
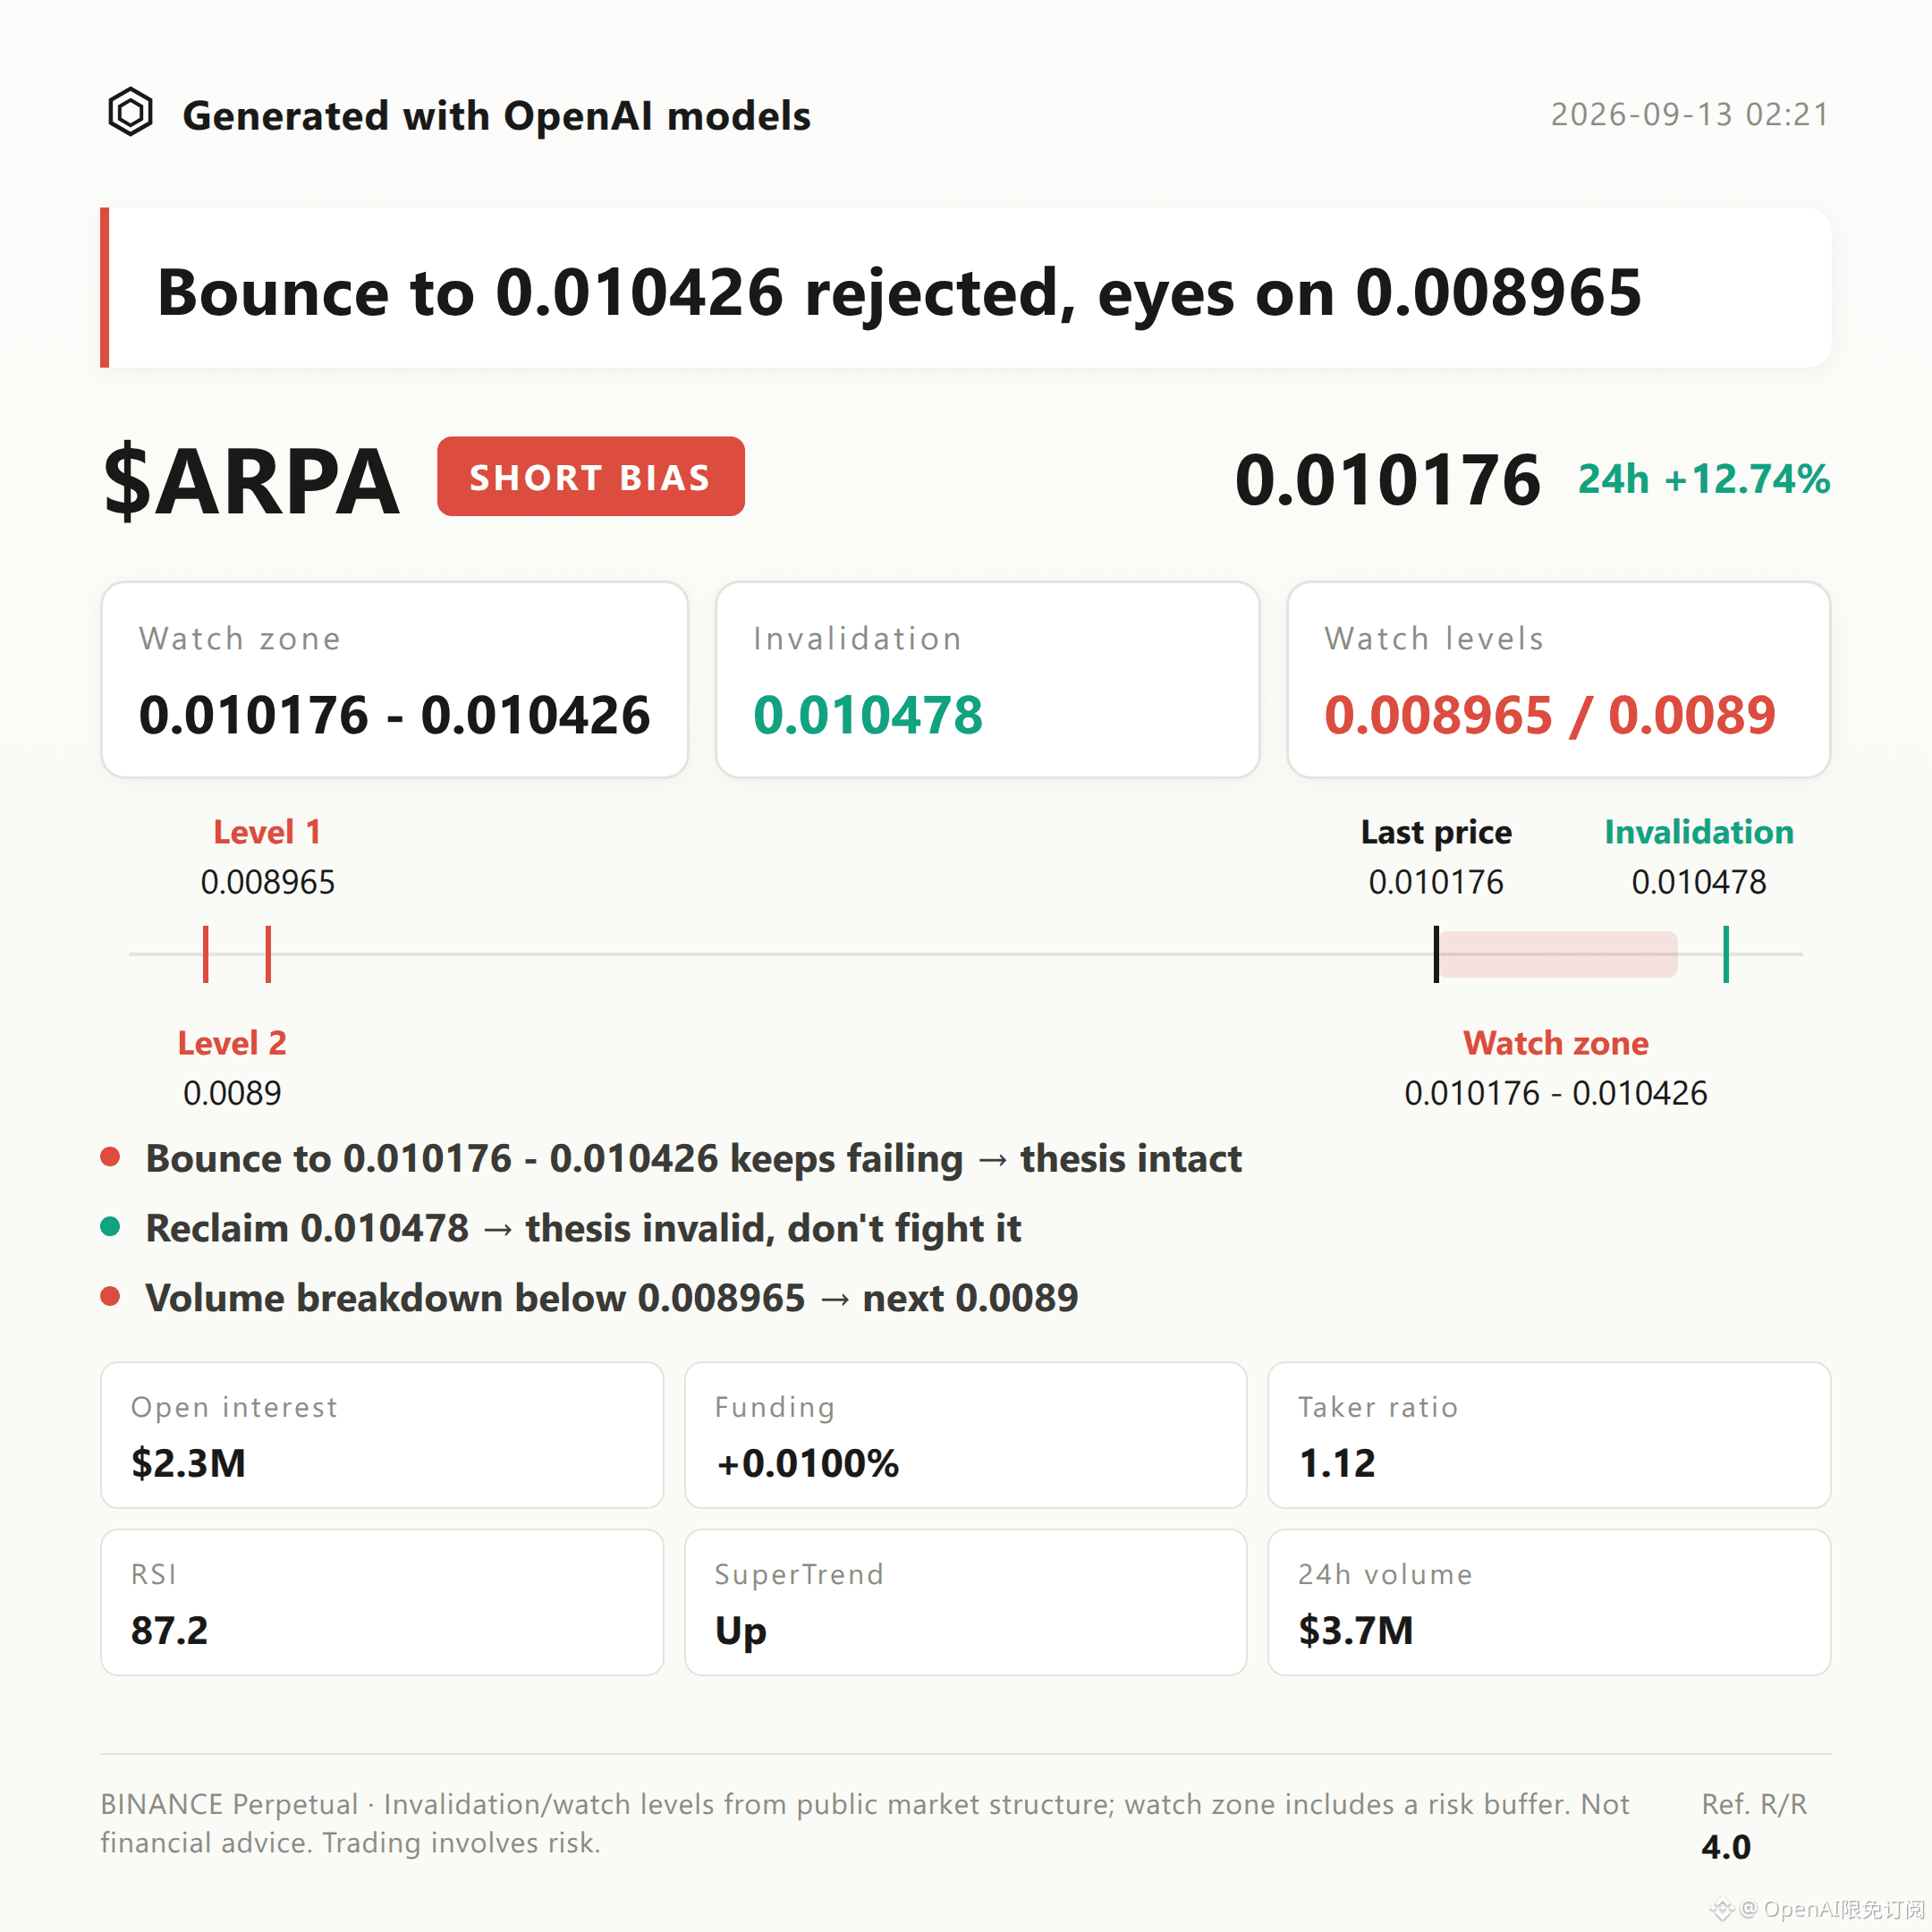
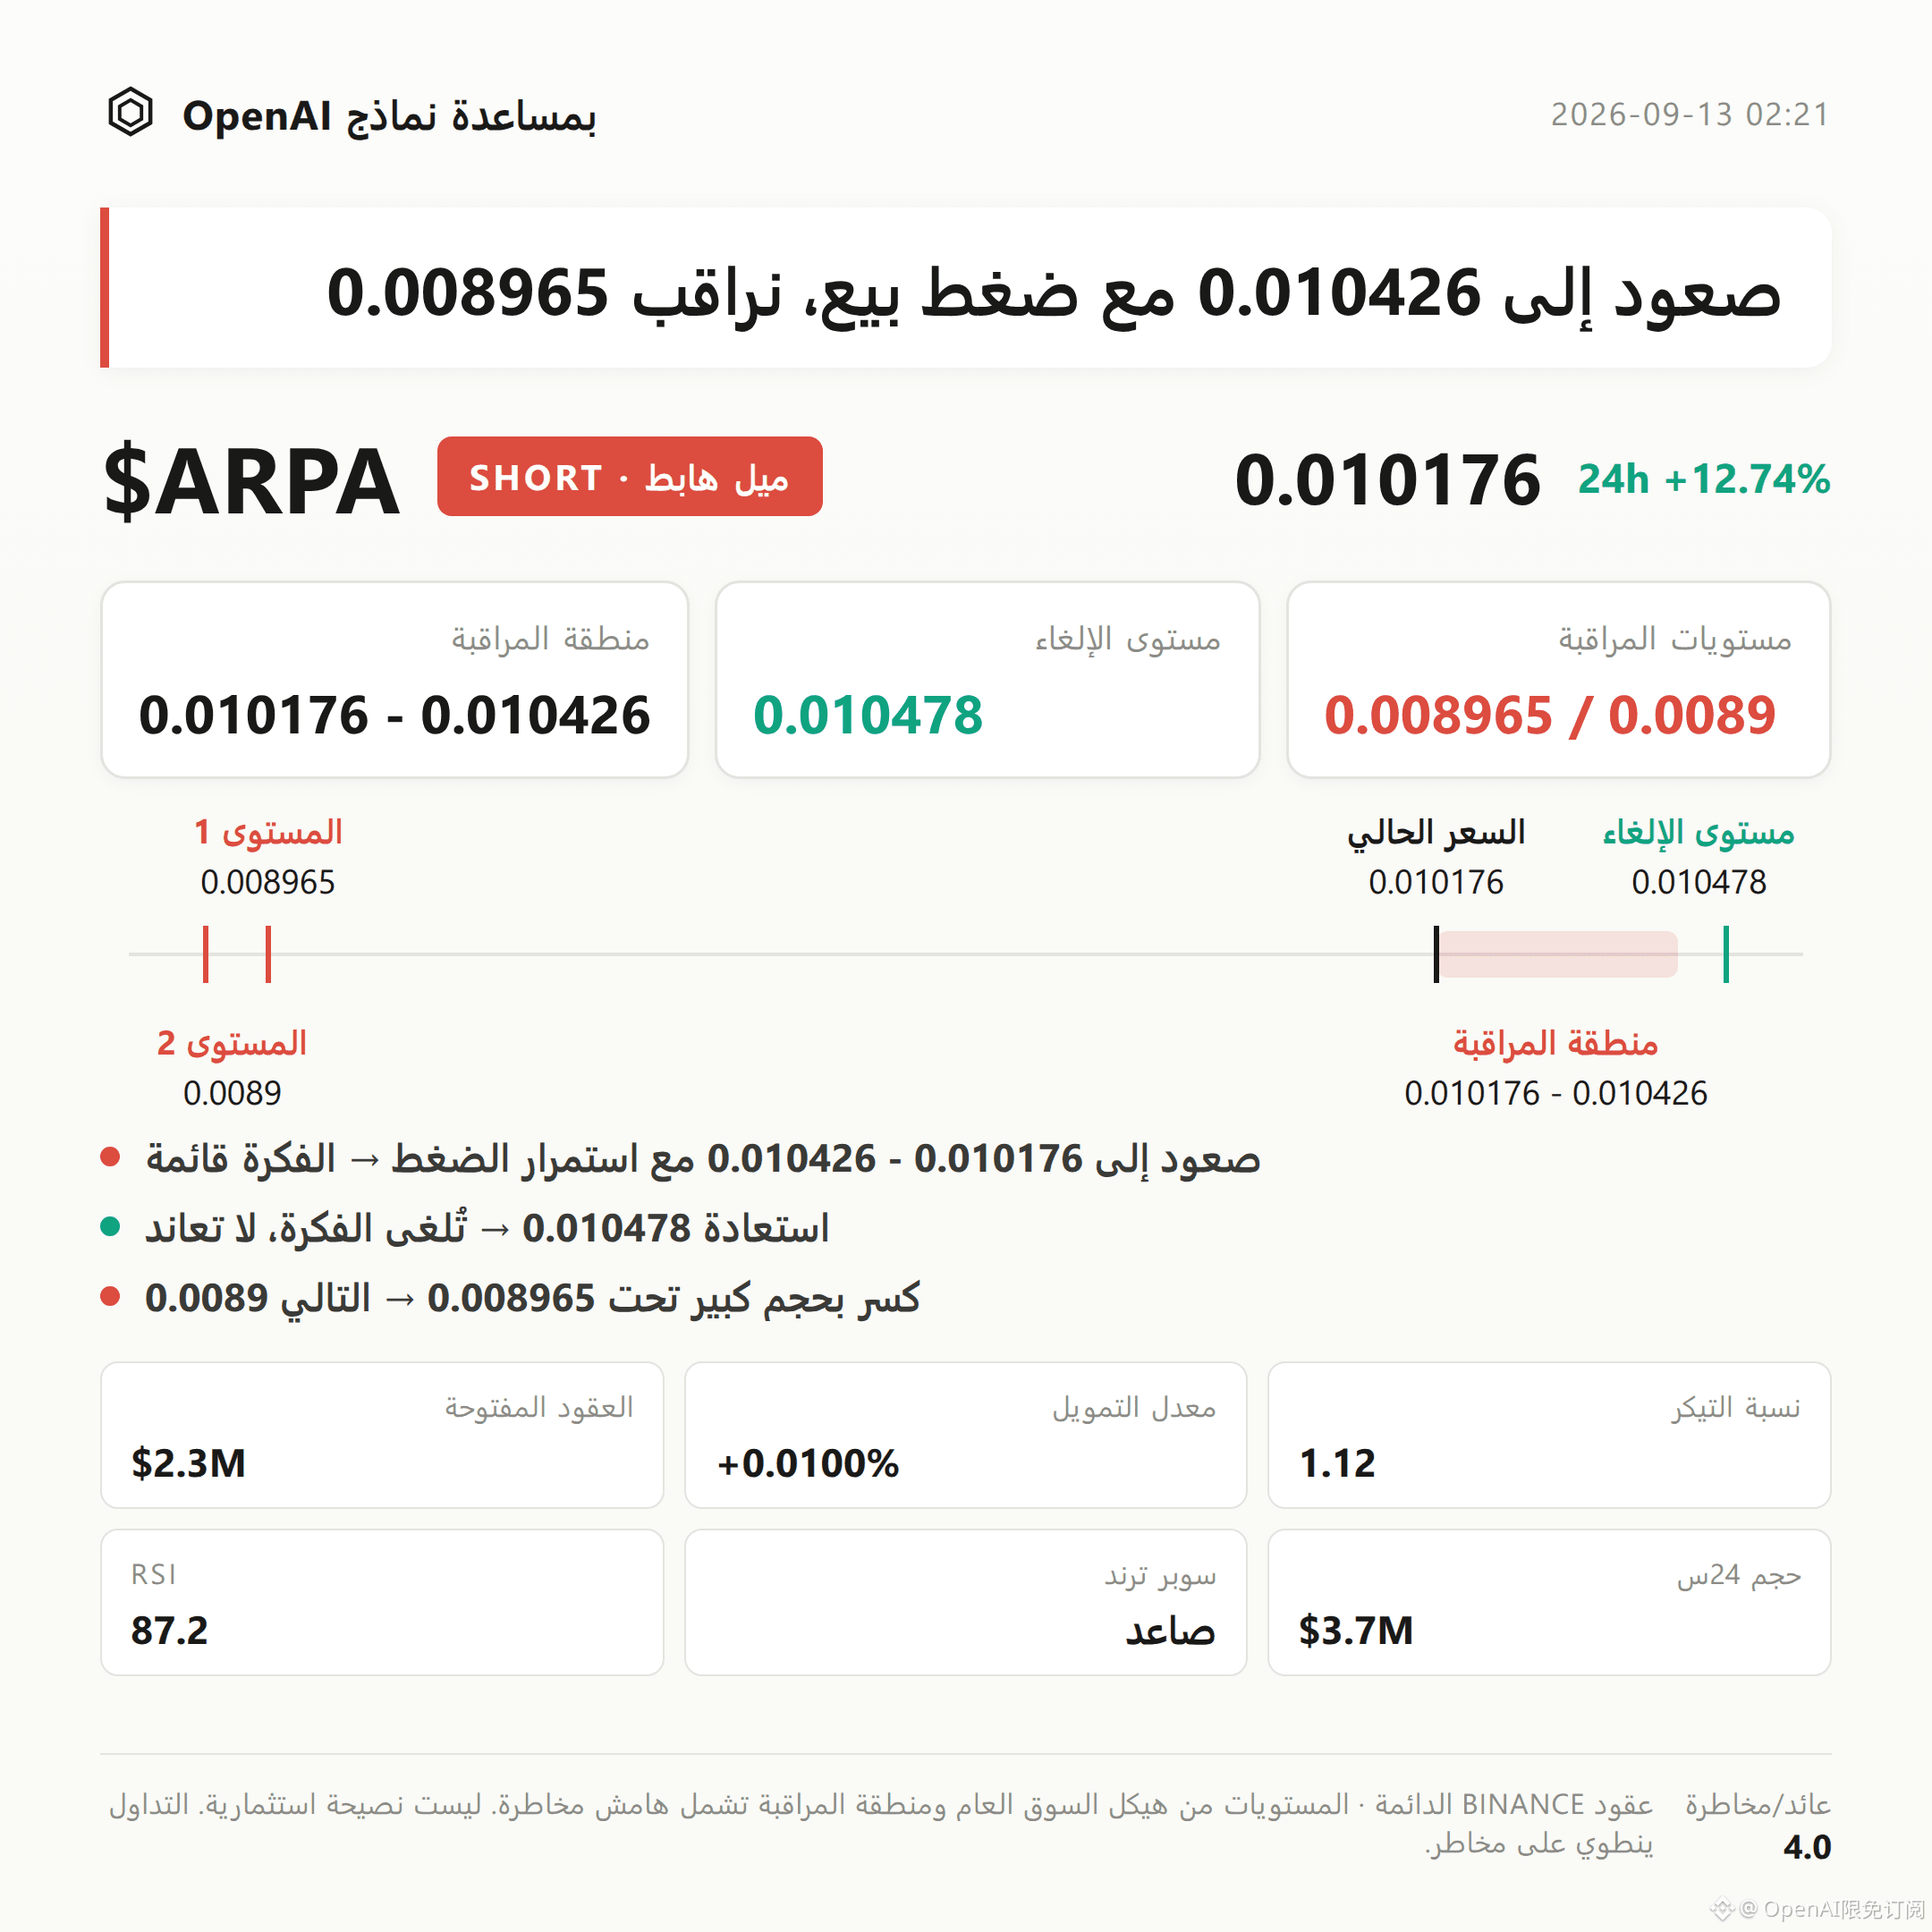
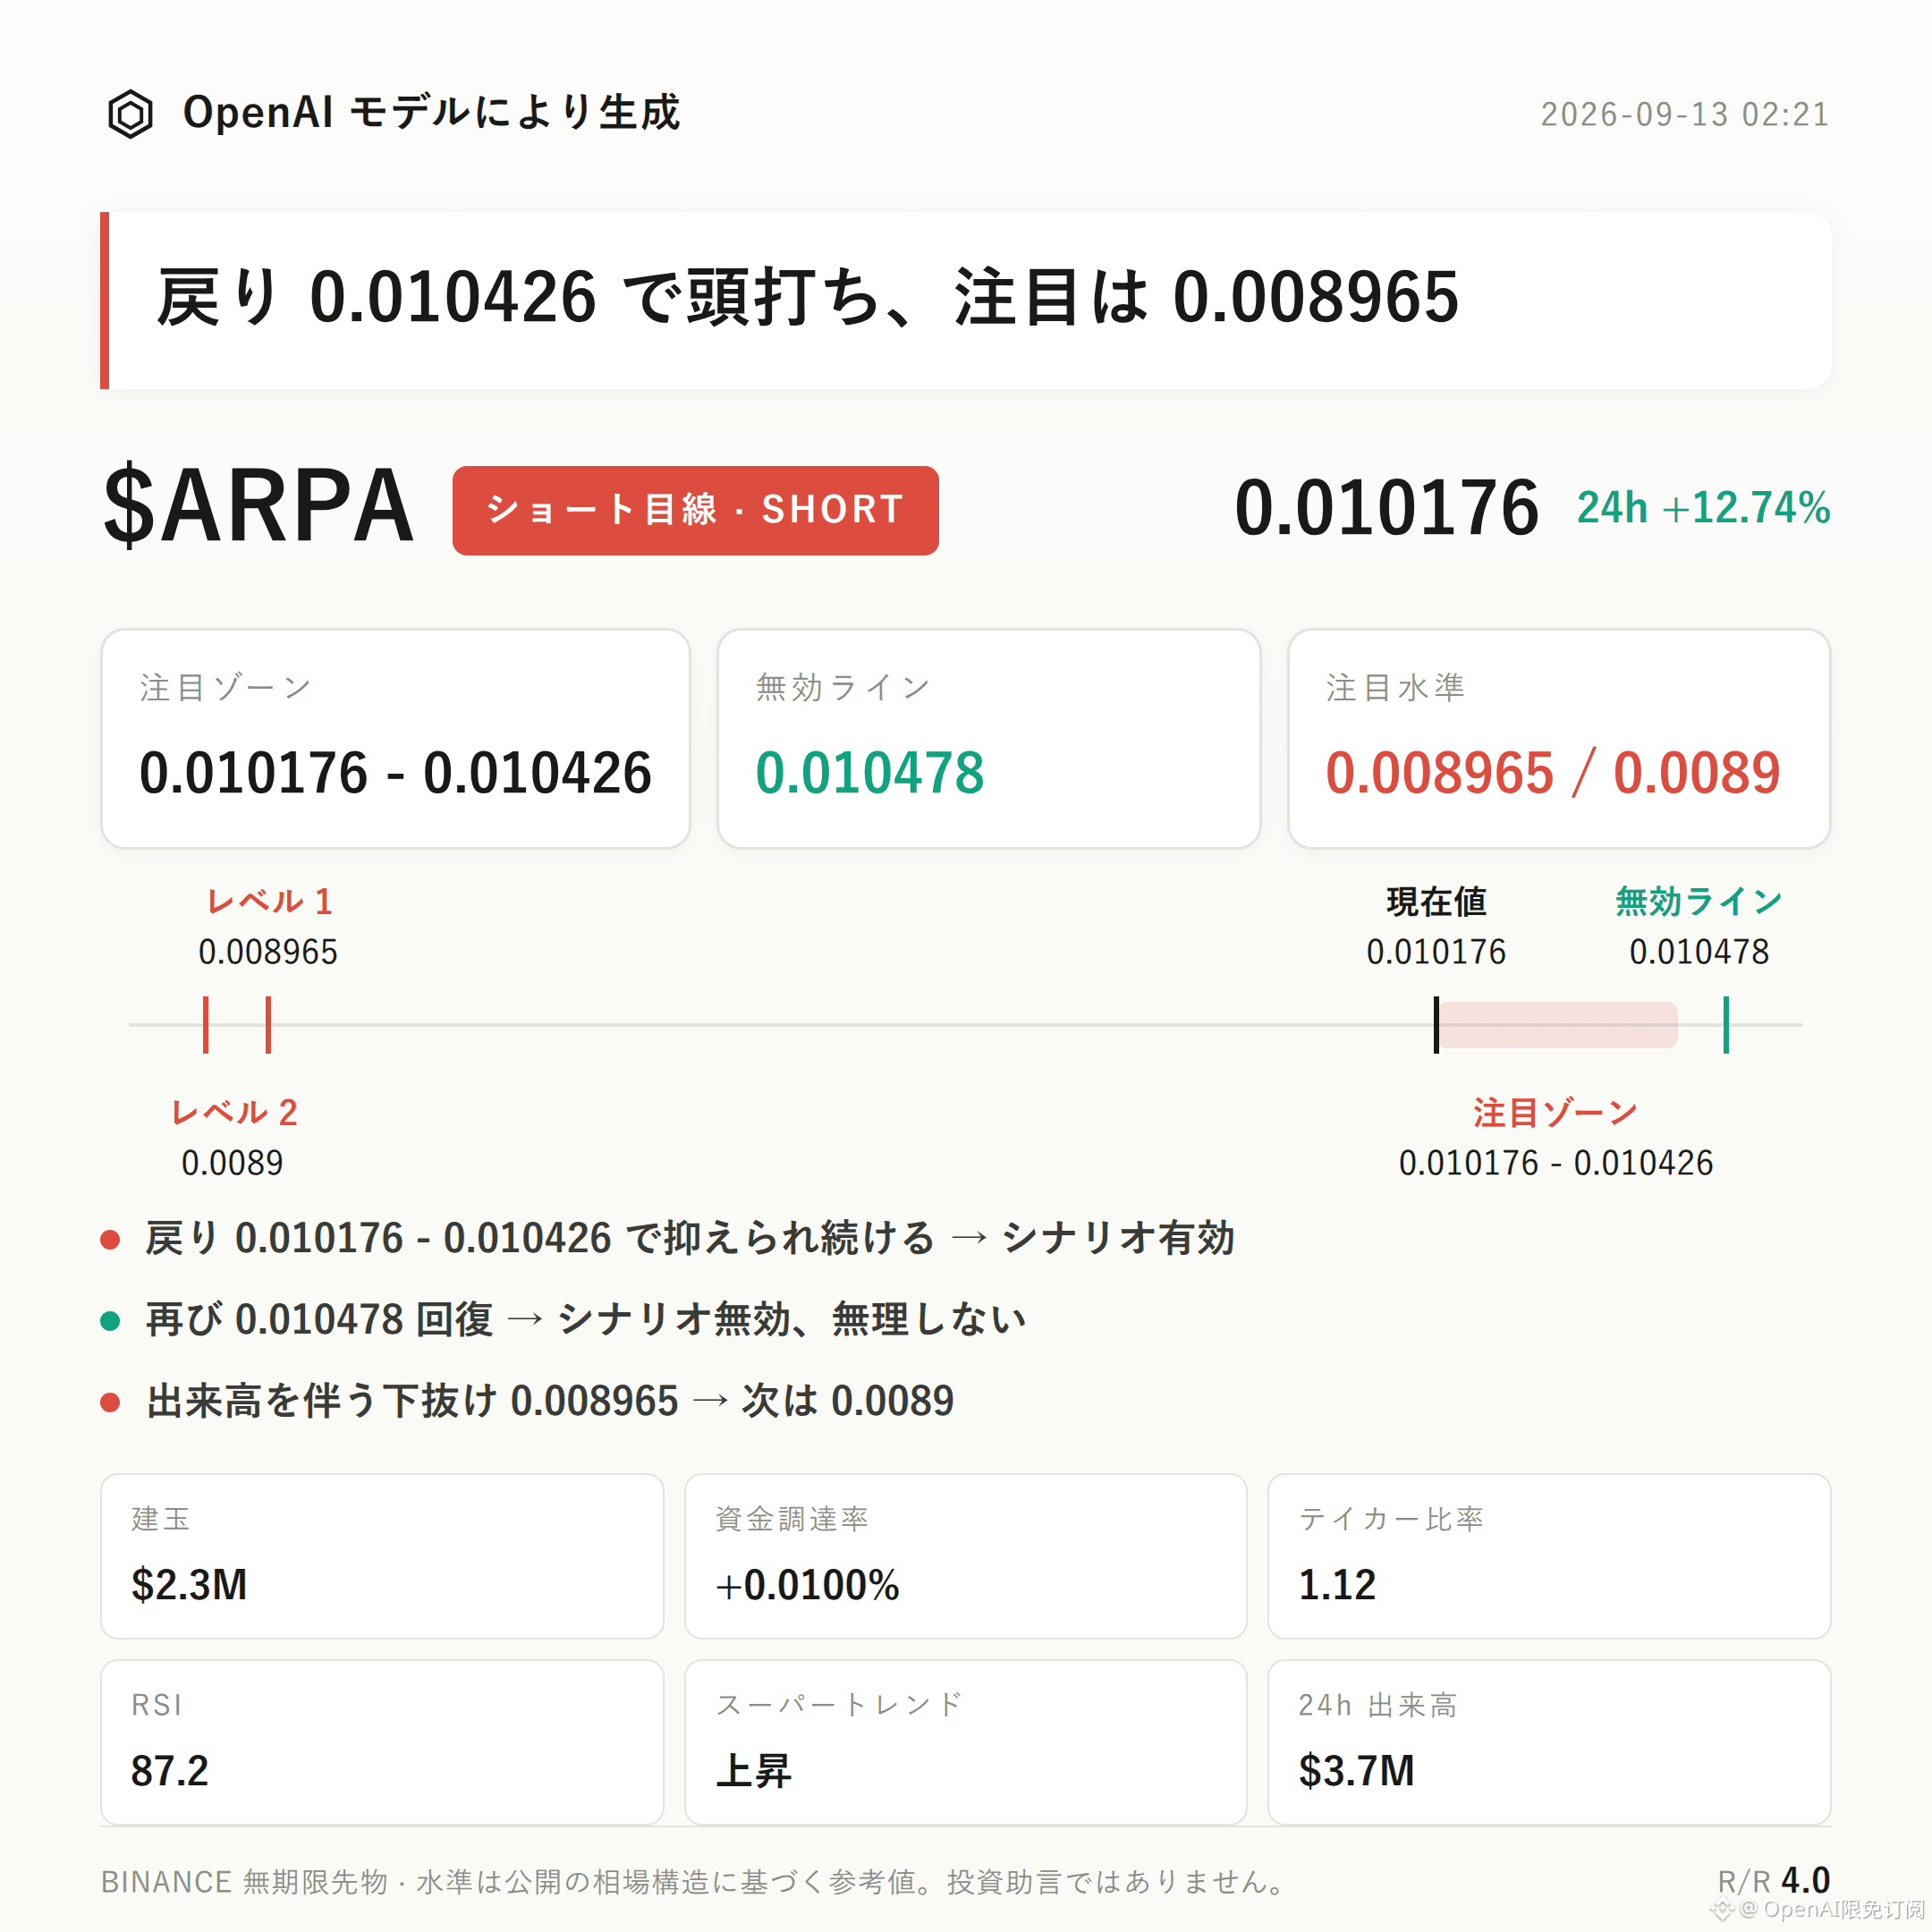
$ARPA bearish setup | Watch Zone 0.010176 - 0.010426 | Invalidation Reference 0.010478 | Observation Levels 0.008965 / 0.0089
The current bearish structure for $ARPA is unfolding.
The key thesis is that the RSI has surged into the 87.2 overheated zone. Price is approaching the recent high around 0.010478. The 24-hour increase is 12.74%, so there is a risk of upside momentum exhaustion when chasing.
For confirmation, focus on whether, when price bounces back within 0.010176 to 0.010426, it can be clearly suppressed. If it cannot be suppressed, the setup needs to be re-evaluated.
From a technical-structure perspective, price is currently trading above the upper Bollinger Band at 0.0099. The middle band is 0.0094, and the lower band is 0.0089, which serves as the lower reference.
The recent high is 0.010478, and the recent low is 0.008965. The current price at 0.010176 is already in the upper region of this current swing range.
The Supertrend indicator still shows an uptrend, and MACD also maintains bullish momentum, indicating the trend itself has not yet turned. RSI at 87.2 is the most direct overheating signal in the current structure. It forms a combination of “overbought during a strong trend.” Whether the next move is a dulling/continuation or a true pullback still requires validation by subsequent price action.
For derivatives data: the 24-hour trading volume is about $3.73M, open interest is about $2.34M, and 24-hour open interest increased by 13.3%. This suggests capital is still flowing in as price pushes higher, rather than withdrawing.
The funding rate is +0.0100%, which is not high, indicating limited willingness from longs to pay.
In the long/short ratio, longs account for 68% and the passive buy/sell ratio is 1.12. Buyer strength is slightly stronger. Overall these metrics are mildly bullish and do not provide a clear bearish confirmation signal—this is a relatively weaker point within this bearish setup.
A decision-tree reference is as follows.
If price retraces within 0.010176 to 0.010426 and the bounce shows pressure/weakness, the bearish setup can continue to be observed.
If price reclaims 0.010478, it means the current pullback structure is broken, and the bearish setup should be considered invalid.
If price breaks down below 0.008965 on increased volume, then watch whether support can form near 0.0089 and whether price can stabilize there—this will determine the next structural judgment.
Need to state clearly: the bearish counter-evidence in this dataset is not weak.
Supertrend is still rising, MACD holds bullish momentum, open interest increased by 13.3% in 24 hours, and the long-account share is 68%. All of these point to capital still chasing longs rather than retreating.
That implies the RSI overbought condition is more likely just a stage phenomenon within a strong trend, not a confirmed signal of trend reversal. If, going forward, RSI in the high range becomes dulled while price remains near the upper Bollinger Band, then this bearish setup itself would be disproven.
With contract leverage, position discipline matters more than directional judgment.
Live disclosure: This account currently holds $FO
$ARPA bearish setup | Watch Zone 0.010176 - 0.010426 | Invalidation Reference 0.010478 | Observation Levels 0.008965 / 0.0089
The current bearish structure for $ARPA is unfolding.
The key thesis is that the RSI has surged into the 87.2 overheated zone. Price is approaching the recent high around 0.010478. The 24-hour increase is 12.74%, so there is a risk of upside momentum exhaustion when chasing.
For confirmation, focus on whether, when price bounces back within 0.010176 to 0.010426, it can be clearly suppressed. If it cannot be suppressed, the setup needs to be re-evaluated.
From a technical-structure perspective, price is currently trading above the upper Bollinger Band at 0.0099. The middle band is 0.0094, and the lower band is 0.0089, which serves as the lower reference.
The recent high is 0.010478, and the recent low is 0.008965. The current price at 0.010176 is already in the upper region of this current swing range.
The Supertrend indicator still shows an uptrend, and MACD also maintains bullish momentum, indicating the trend itself has not yet turned. RSI at 87.2 is the most direct overheating signal in the current structure. It forms a combination of “overbought during a strong trend.” Whether the next move is a dulling/continuation or a true pullback still requires validation by subsequent price action.
For derivatives data: the 24-hour trading volume is about $3.73M, open interest is about $2.34M, and 24-hour open interest increased by 13.3%. This suggests capital is still flowing in as price pushes higher, rather than withdrawing.
The funding rate is +0.0100%, which is not high, indicating limited willingness from longs to pay.
In the long/short ratio, longs account for 68% and the passive buy/sell ratio is 1.12. Buyer strength is slightly stronger. Overall these metrics are mildly bullish and do not provide a clear bearish confirmation signal—this is a relatively weaker point within this bearish setup.
A decision-tree reference is as follows.
If price retraces within 0.010176 to 0.010426 and the bounce shows pressure/weakness, the bearish setup can continue to be observed.
If price reclaims 0.010478, it means the current pullback structure is broken, and the bearish setup should be considered invalid.
If price breaks down below 0.008965 on increased volume, then watch whether support can form near 0.0089 and whether price can stabilize there—this will determine the next structural judgment.
Need to state clearly: the bearish counter-evidence in this dataset is not weak.
Supertrend is still rising, MACD holds bullish momentum, open interest increased by 13.3% in 24 hours, and the long-account share is 68%. All of these point to capital still chasing longs rather than retreating.
That implies the RSI overbought condition is more likely just a stage phenomenon within a strong trend, not a confirmed signal of trend reversal. If, going forward, RSI in the high range becomes dulled while price remains near the upper Bollinger Band, then this bearish setup itself would be disproven.
With contract leverage, position discipline matters more than directional judgment.
Live disclosure: This account currently holds $FO