

August 2026 has just recorded one of the most interesting price-action histories for us to analyze both technically and fundamentally.
As traders, we know that price movements don't just happen in a vacuum; there are always traces of capital and volume left behind. Let's dissect the latest research data to see who was actually pumping the market last month and why this current uptrend structure is far stronger than what appears on the surface.
📊 1. Recap: One of the Sharpest Rallies in the Last 5 Years
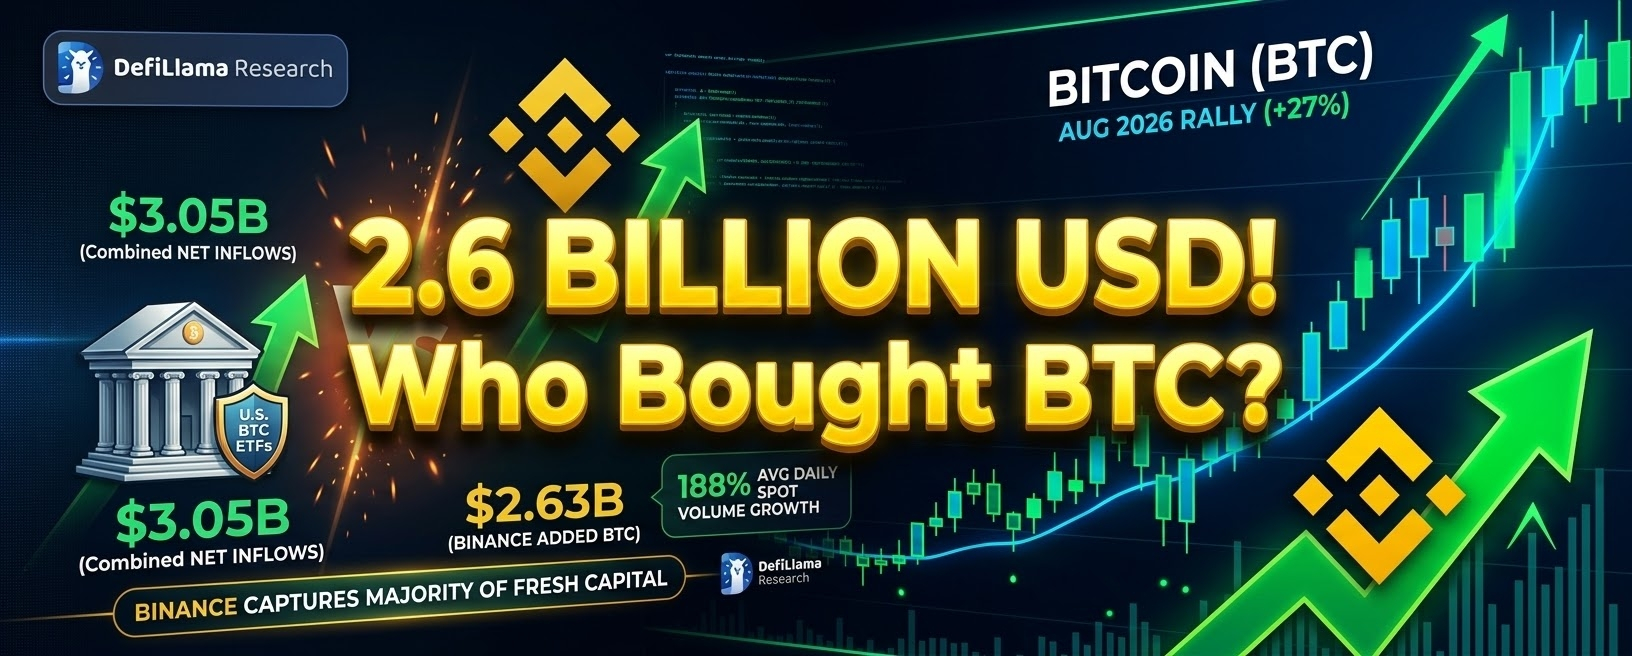
For those of you who keep monitoring price action: on August 19, 2026, Bitcoin successfully broke through a narrow consolidation zone in the $62,000 to $66,000 range. Even more impressively, in just a matter of days, the price surged sharply to reach around the $81,500 level on August 25. This price increase represents a 27% jump from the initial breakout point, making it one of the sharpest weekly moves we’ve witnessed in the past five years.
💰 2. Dissecting Capital Flows: Institutional ETF vs Binance Platform Strength
Many narratives out there claim that traditional institutions, through ETF instruments, are the only main player behind this rally. However, research data shows a different reality. All spot Bitcoin ETFs in the United States collectively recorded net inflows of $3.05 billion during that period.
However, Binance is actually the party that absorbed a large portion of the fresh capital directly in the crypto exchange market. During that rise period, Binance recorded an extraordinary and massive increase in its BTC balance, worth $2.63 billion. This balance increase on Binance is twice as large as that of the second-largest crypto exchange, proving that real capital flows are more likely to enter through this ecosystem.
⚙️ 3. The Anatomy of the Price Rise: Evidence of a Very "Healthy" Rally (Spot vs Leverage)
This is the most crucial part for us who prioritize risk management. Price increases that are driven only by leverage (borrowed funds) are highly vulnerable to brutal corrections due to margin calls or cascading liquidations. The good news is that this August rally was funded by genuine spot buying.
Data shows that the average spot trading volume across the entire market surged by 153.1% (from $20.07 billion to $50.79 billion per day) during the breakout week. This figure far outpaced the growth of futures contracts (perpetuals), which rose by only 109.1% (from $120.77 billion to $252.59 billion per day). As a result, the perp-to-spot ratio in the market experienced sharp compression, dropping by 17.4% from 6.02 to 4.97.
Even more astonishingly, the total leverage or debt in the market actually shrank. Open Interest (OI), measured in BTC terms, fell by 8.5% while the price was surging higher. This is clear confirmation that the price rally is supported by real capital, not borrowed money from speculators.
🌊 4. Liquidity Dominance and the Importance of Market Depth
When billions of dollars flow back into the market, that capital automatically seeks the platform offering the best market depth and execution quality. This is where Binance again shows its teeth.
Those inflows were immediately translated into massive trading activity. The average daily spot trading volume on Binance jumped sharply from $4.75 billion to $13.69 billion, an increase of 188%. This achievement is not only far above the average market growth rate, but it also makes Binance the only exchange whose daily trading volume has been able to break above $10 billion. Overall, Binance controlled 46% of the total spot trading volume across all exchanges.
🔍 5. Conclusion: What Are the Next Steps for Traders?
Based on a joint analysis from DefiLlama and Binance Research, the main phase of pressure in the market likely has already been successfully passed. Bitcoin’s next price move will depend heavily on how the demand dynamics from spot instruments and ETFs develop going forward.
Since market demand can be clearly measured when balances or capital move into the exchange, volume and capital flows (flows) on Binance will become the leading indicators. On this platform, analysts and traders can directly see whether this demand and liquidity trend continues to stay strongly intact, or whether it starts to fade. Binance’s dominance shows that the platform keeps serving as a bridge to the future for global finance—connecting traditional and digital markets while keeping financial opportunities open and accessible to everyone.
What’s your take on the dynamics of spot vs leverage? Let’s discuss your technical analysis in the comments section! 👇