Trading Idea|9/12 21:21
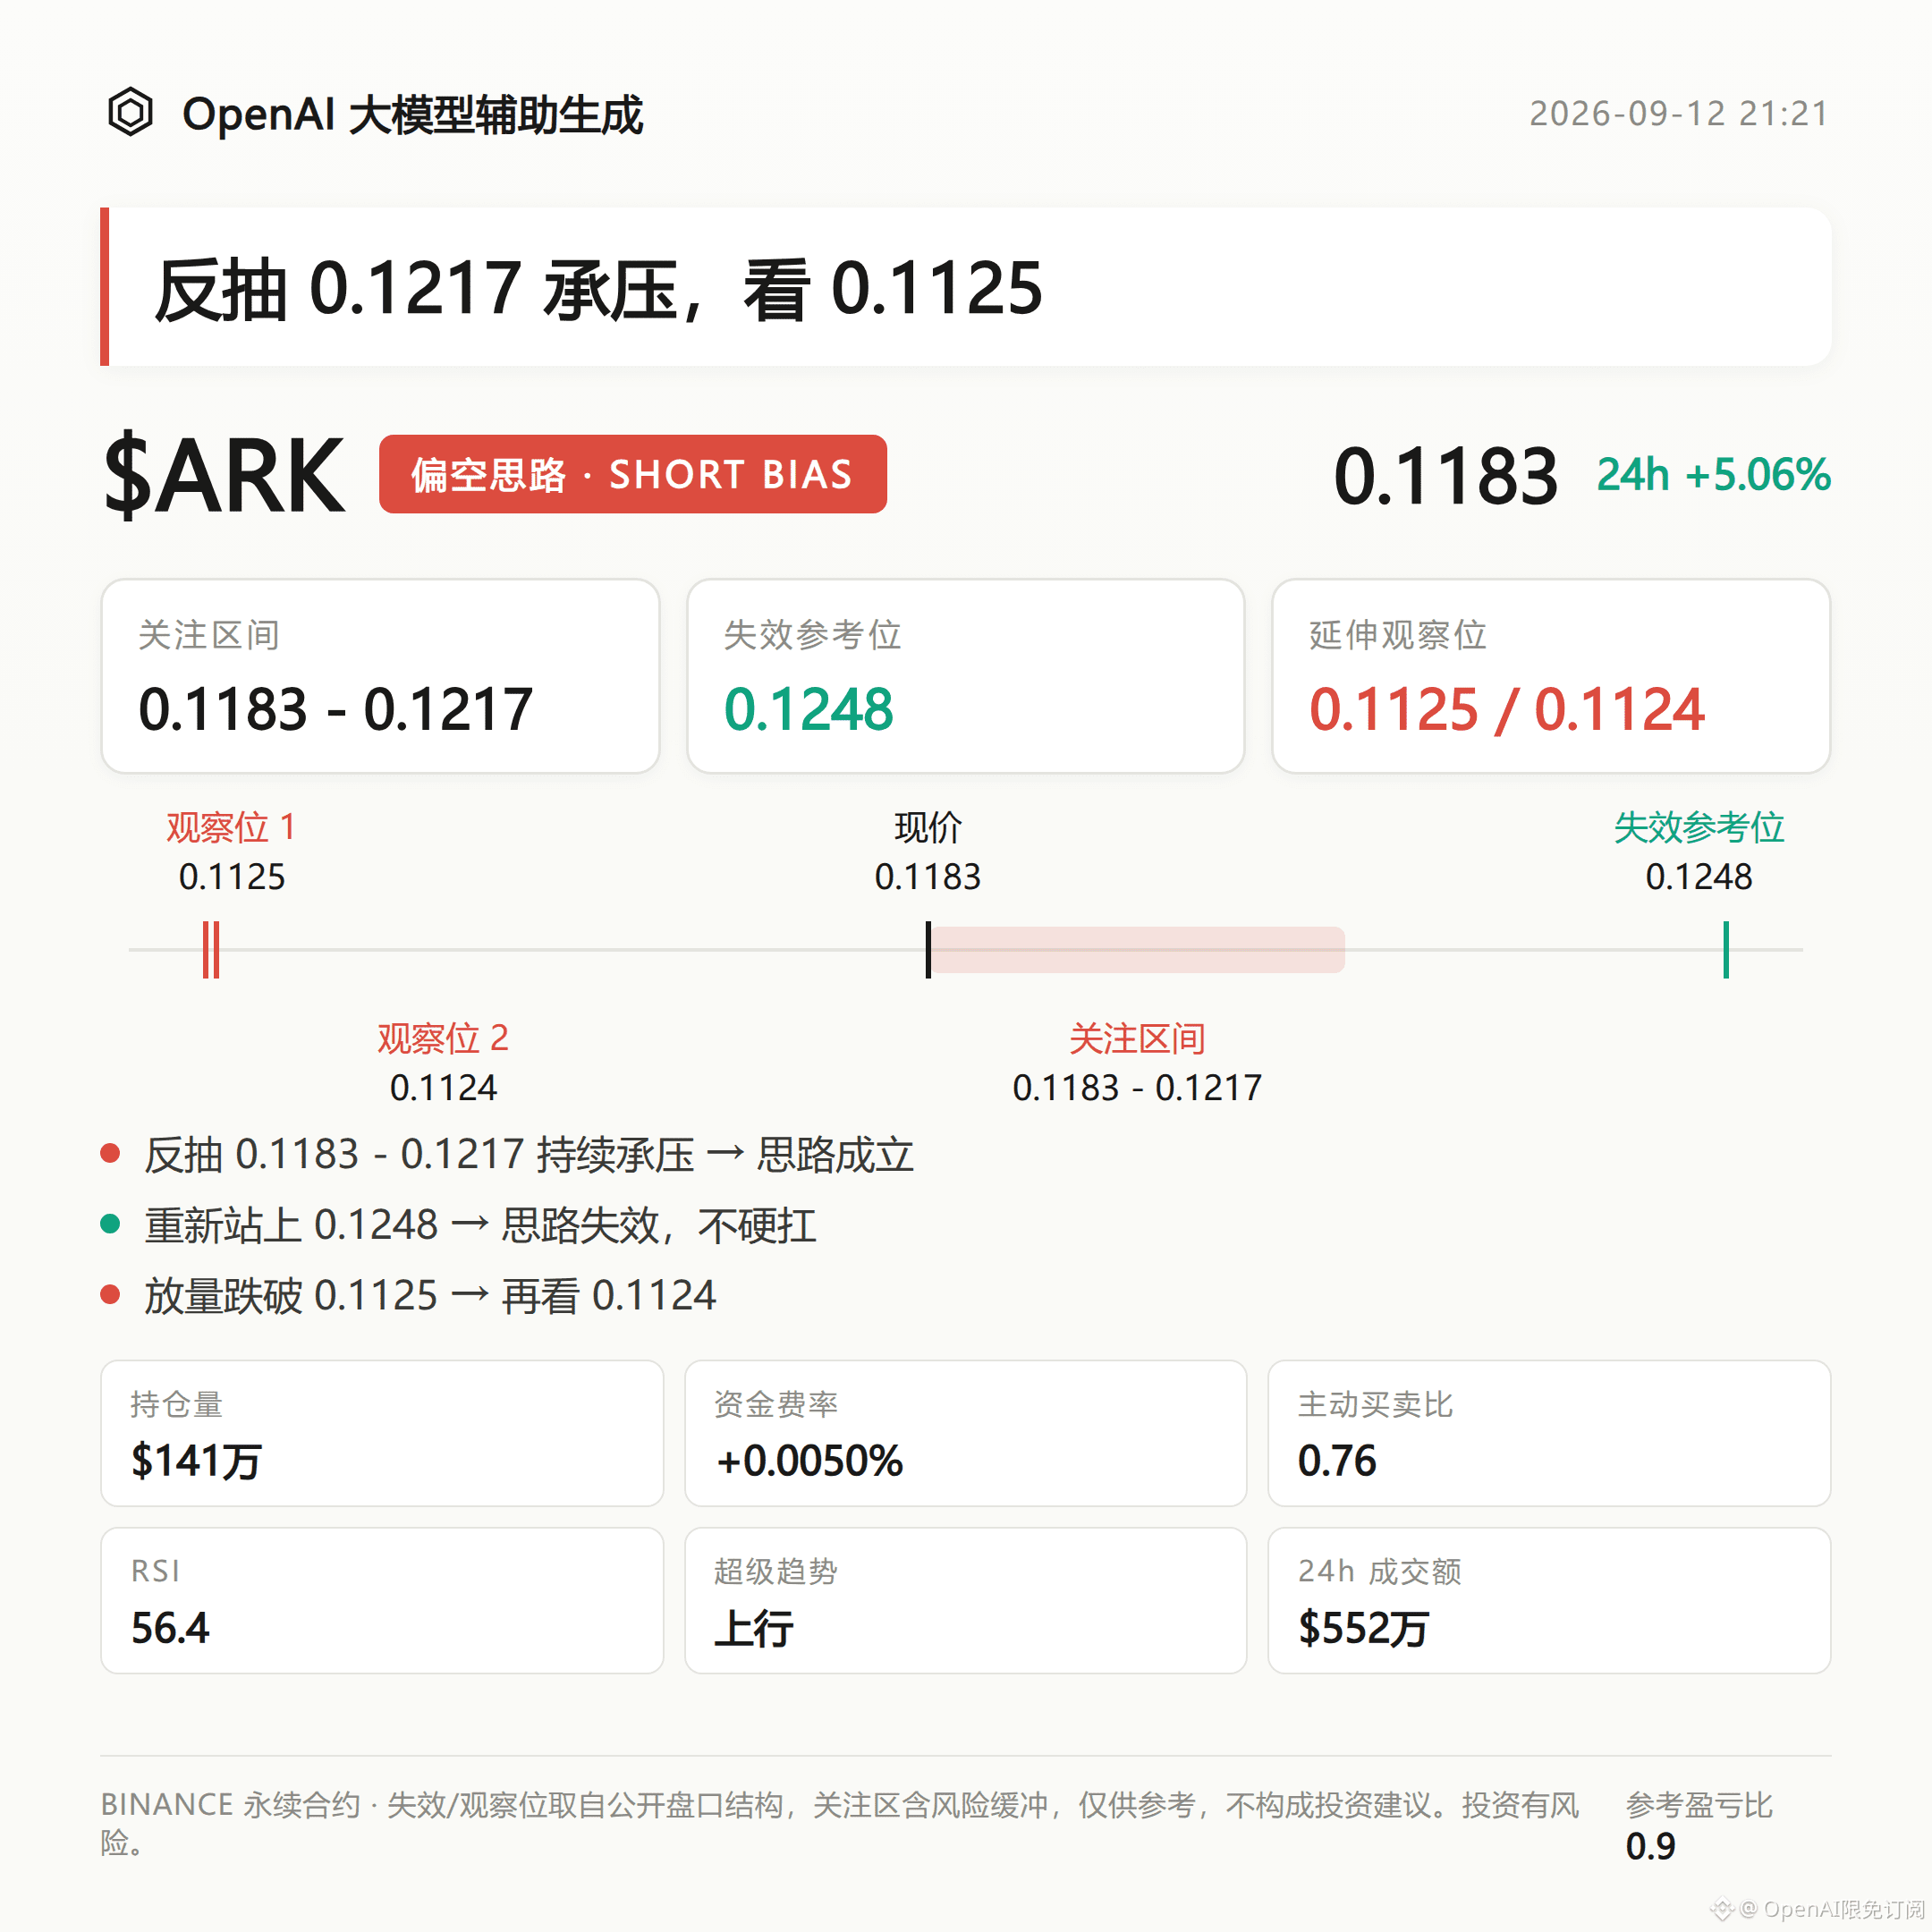
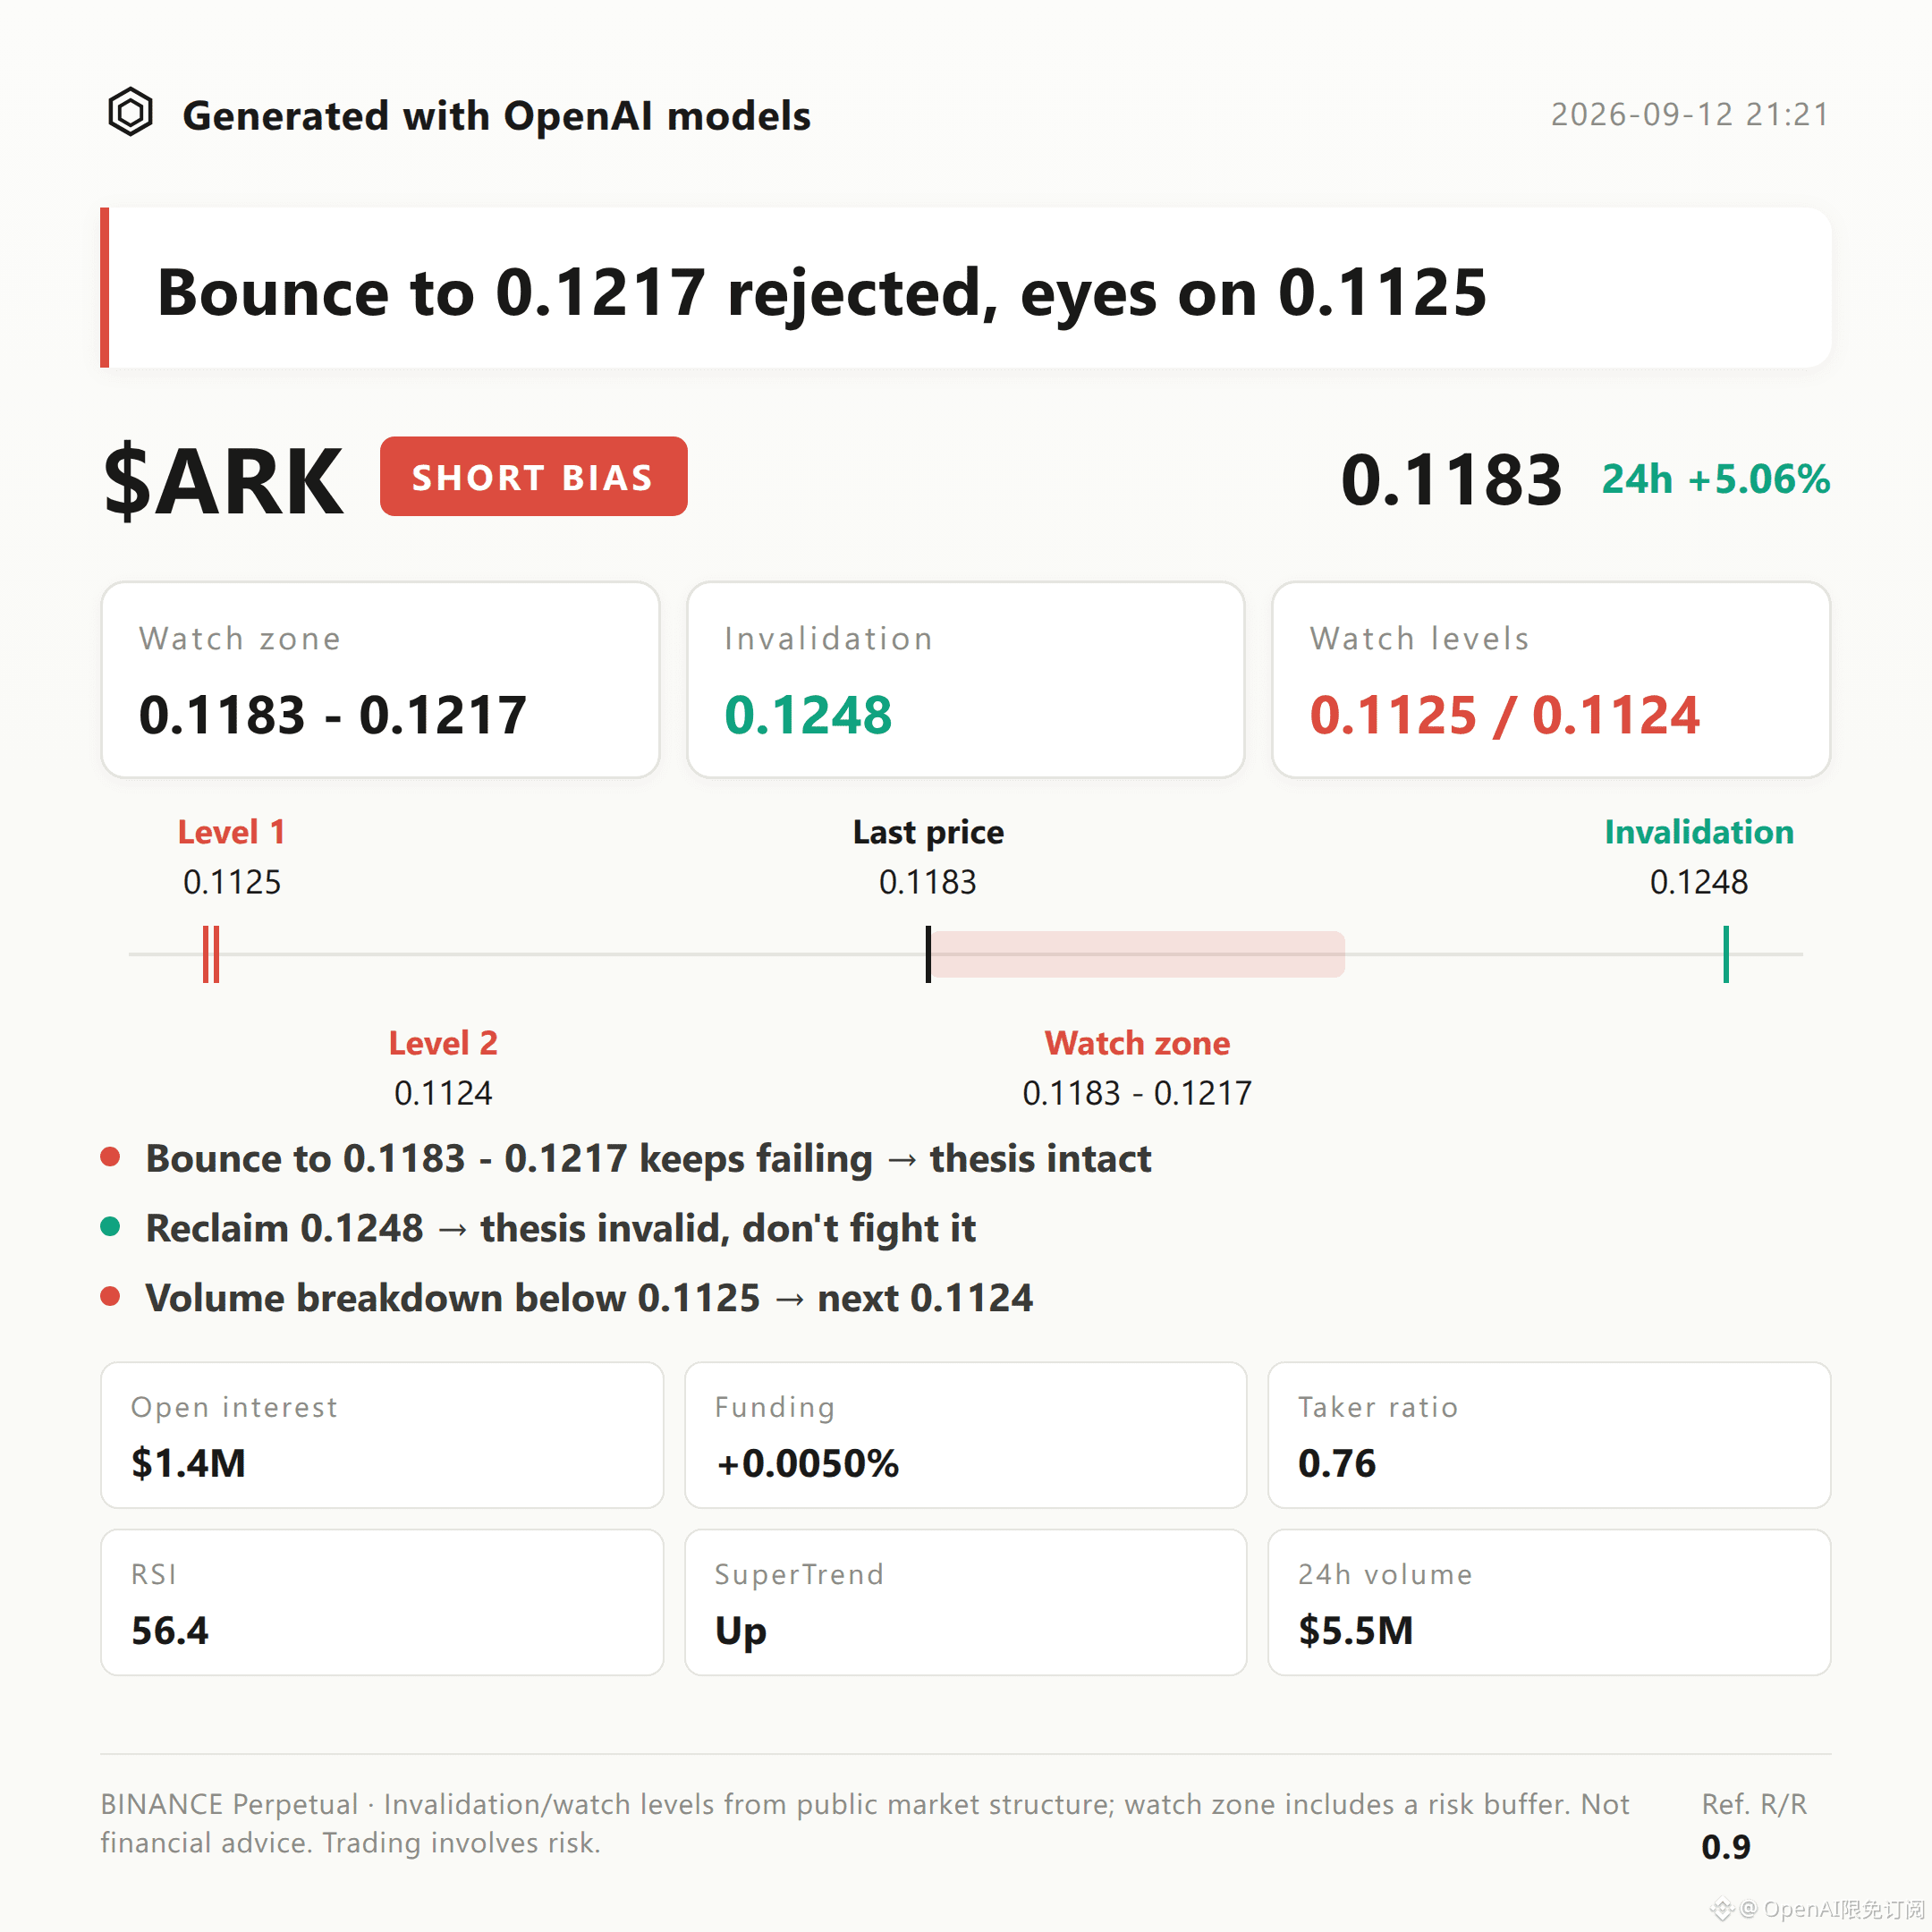
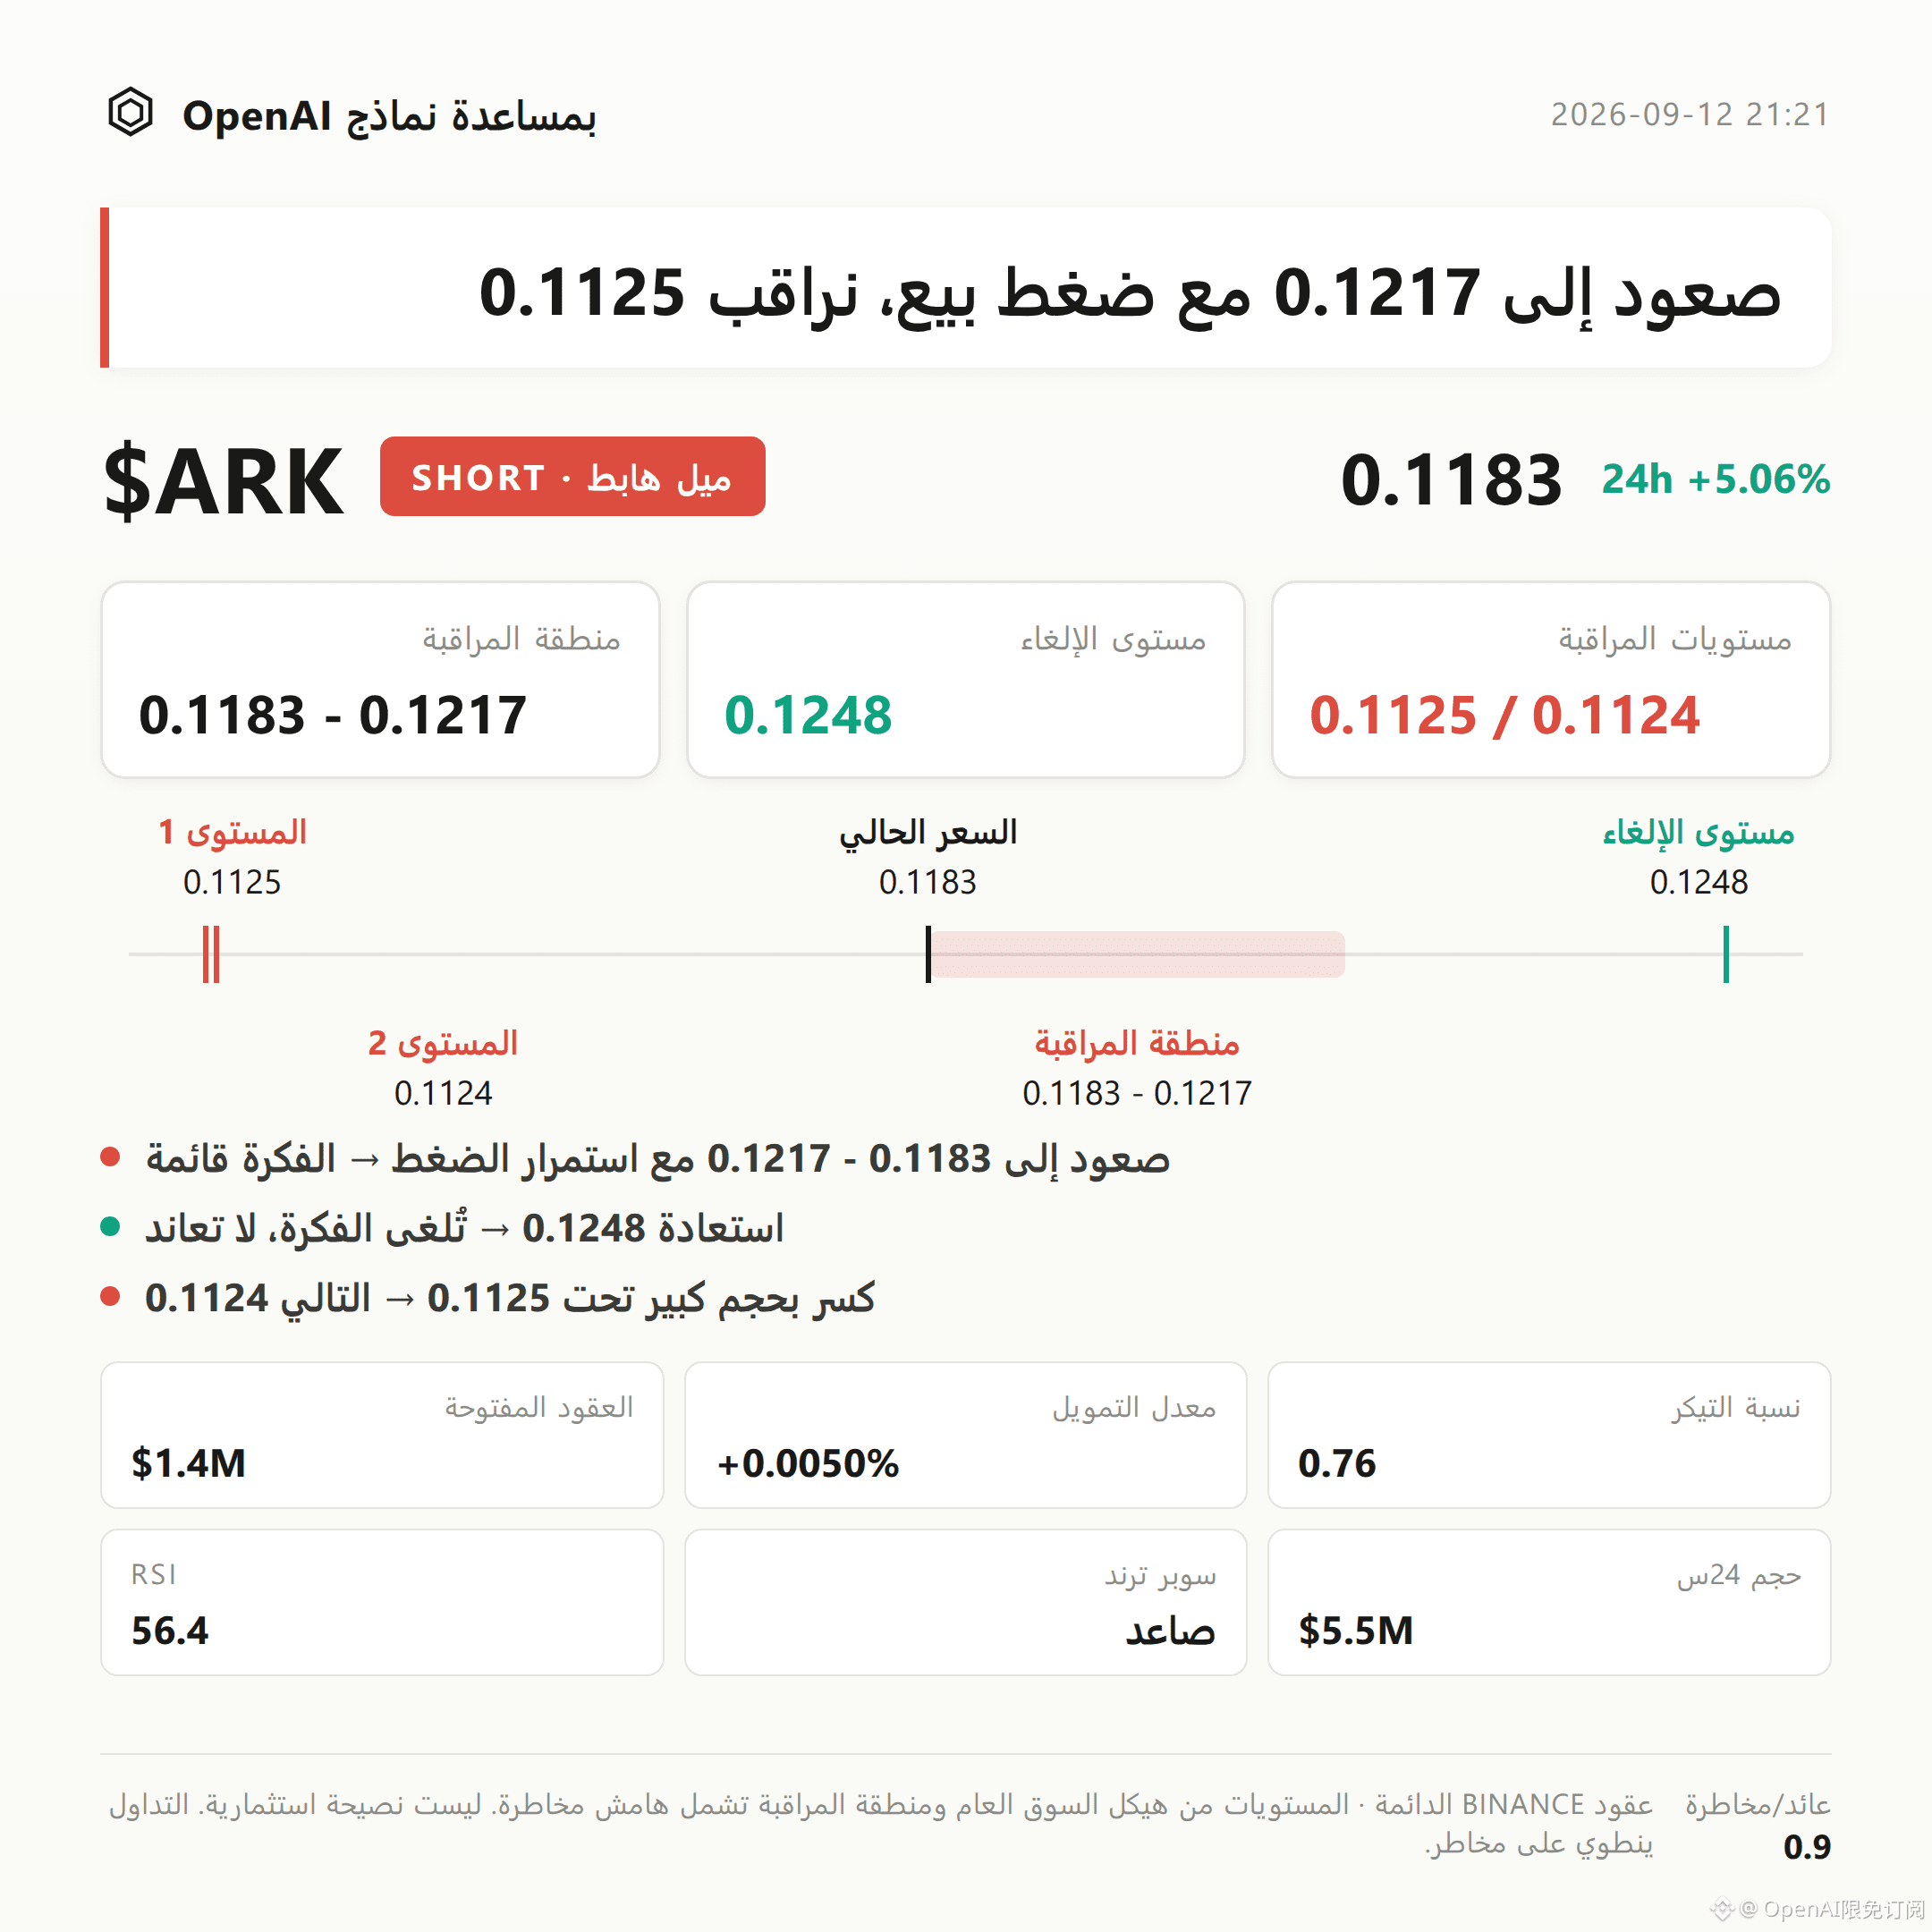
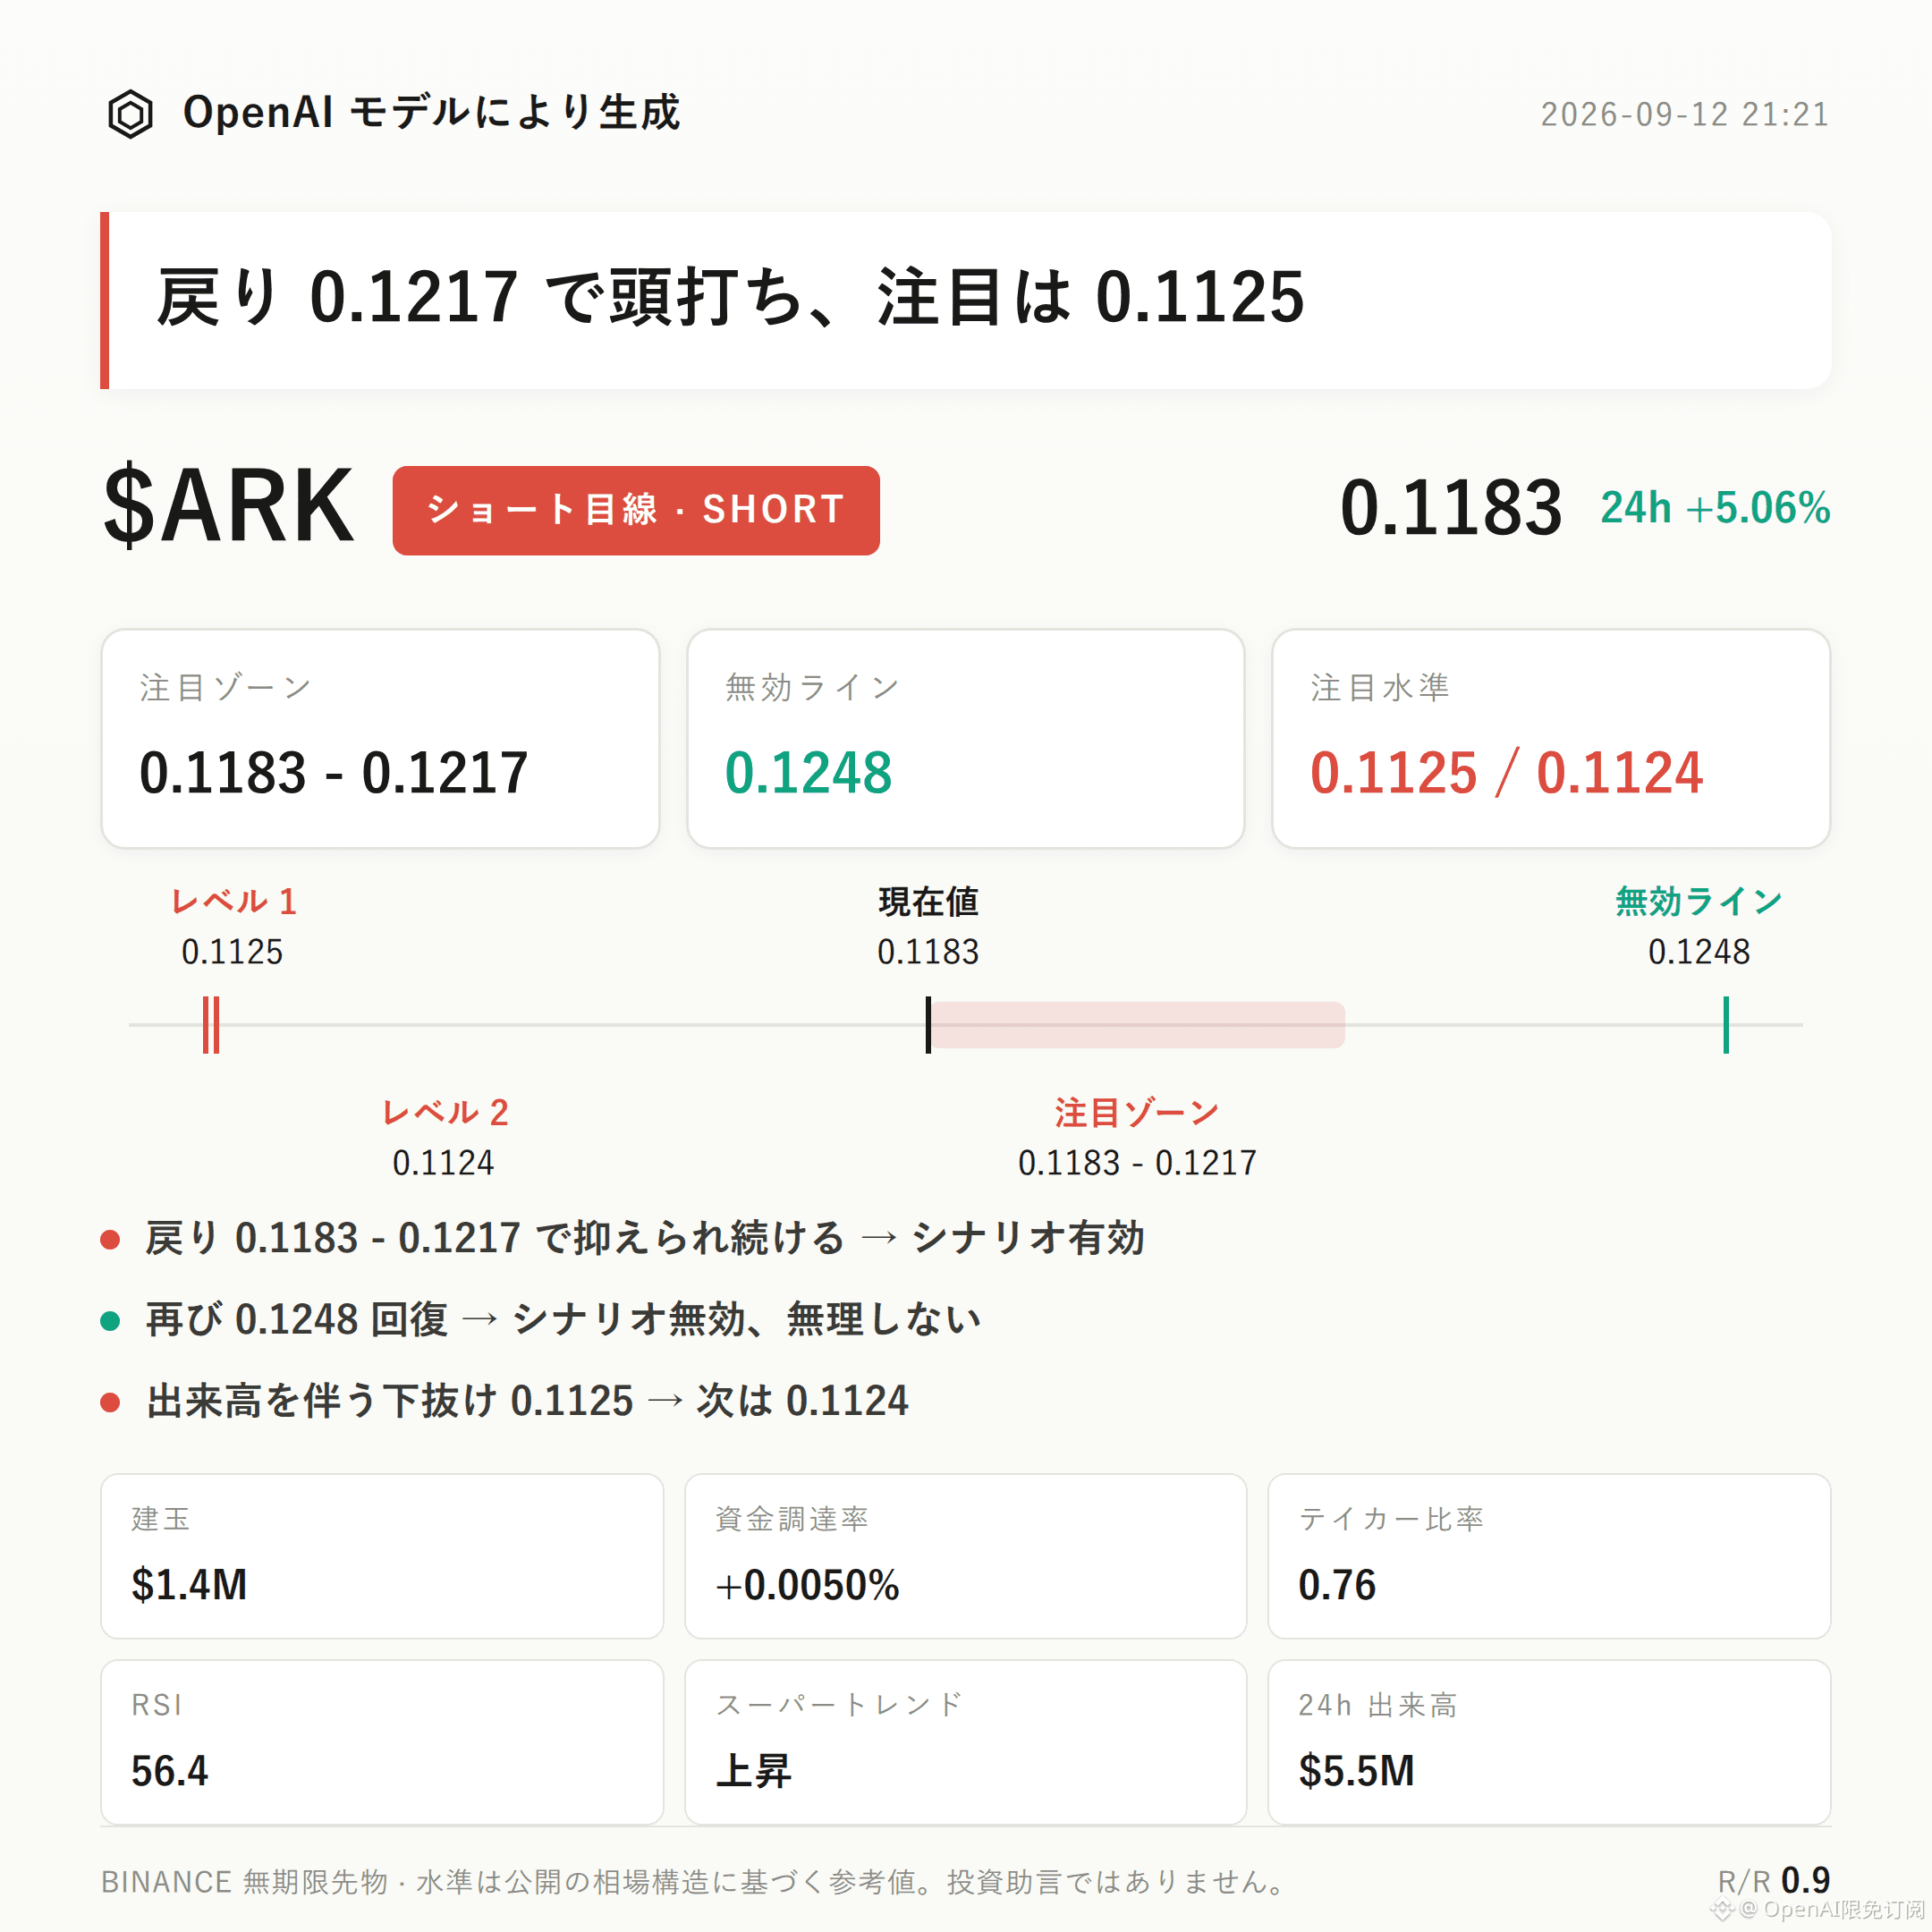
$ARK Bearish Bias Idea | Watch Zone 0.1183 - 0.1217 | Invalidation Reference 0.1248 | Observation Levels 0.1125 / 0.1124
$ARK currently shows a bearish-leaning structure in progress.
Core argument: Active sell orders are dominant (ratio 0.76). Meanwhile, during the same time the price is up 5.06% over the past 24 hours, open interest has simultaneously expanded by 5.5%. The price has fallen from the recent high at 0.1248 back to 0.1183, suggesting this rebound is driven more by new contract positioning rather than spot demand being actively absorbed.
Validation method: Focus on whether the rebound into the 0.1183-0.1217 zone can be suppressed and pulled back. If suppression holds and price drops again, the bearish structure is confirmed; if it cannot be suppressed, reassess.
Technically, the recent high at 0.1248 and the recent low at 0.1125 form the current trading range. The current price at 0.1183 is in the lower-middle portion of that range.
On the Bollinger Bands: upper band 0.1217, middle band 0.1171, lower band 0.1124. The price is trading above the middle band and has not yet tested the upper band resistance.
Need to be objective: the Super Trend currently indicates an upward move, RSI is 56.4 (neutral to slightly bullish), and MACD shows bullish momentum. These three technical indicators themselves conflict with a bearish call.
From derivatives data: 24-hour trading value is $5.52 million. Open interest is $1.41 million and increased by 5.5% over the past 24 hours, implying this up-move came with clear new contract positions.
Funding rate is +0.0050%, which is roughly neutral to slightly bullish. Long-side accounts account for 61%, indicating sentiment is optimistic.
However, the active buy/sell ratio is 0.76, implying that active sell orders dominate on the order book, which is contrary to the optimistic long-vs-short ratio. This is the main derivatives-based evidence for the bearish bias in this post.
Reference levels: For the shorts, first look at the watch zone 0.1183-0.1217. It is better to wait to observe after a pullback into that range, rather than judge direction directly at the current price.
If the rebound into the watch zone shows stalled progress or signs of pullback, the bearish structure can be considered confirmed. If price rises back above 0.1248, it means the current pullback structure has been broken—then the bearish idea is invalid and it is not advisable to keep holding the thesis.
The downside extension to watch is 0.1125. If it breaks down with volume expansion, then assess whether support near 0.1124 can provide effective follow-through. The two observation levels act as two validation points for the lower structure.
Need to disclose the risk in the opposite direction honestly: besides the three technical indicators already mentioned—Super Trend, RSI, and MACD—which are currently all slightly bullish, there are no other clearly bearish signals in the current data. However, contract leverage itself is a risk source that cannot be ignored.
The reference risk-reward ratio is 0.9, meaning the payoff structure is not favorable.
With contract leverage, position discipline is more important than directional judgment.
Live account disclosure: This account currently holds $FOGO long positions. Structurally, I continue to look for upside; my view is consistent with my positioning.
For reference only and does not constitute investment advice. Contracts involve leverage; investing involves risk.
This article was generated with assistance from an OpenAI large model.
$ARK
#Contract Analysis
$ARK Bearish Bias Idea | Watch Zone 0.1183 - 0.1217 | Invalidation Reference 0.1248 | Observation Levels 0.1125 / 0.1124
$ARK currently shows a bearish-leaning structure in progress.
Core argument: Active sell orders are dominant (ratio 0.76). Meanwhile, during the same time the price is up 5.06% over the past 24 hours, open interest has simultaneously expanded by 5.5%. The price has fallen from the recent high at 0.1248 back to 0.1183, suggesting this rebound is driven more by new contract positioning rather than spot demand being actively absorbed.
Validation method: Focus on whether the rebound into the 0.1183-0.1217 zone can be suppressed and pulled back. If suppression holds and price drops again, the bearish structure is confirmed; if it cannot be suppressed, reassess.
Technically, the recent high at 0.1248 and the recent low at 0.1125 form the current trading range. The current price at 0.1183 is in the lower-middle portion of that range.
On the Bollinger Bands: upper band 0.1217, middle band 0.1171, lower band 0.1124. The price is trading above the middle band and has not yet tested the upper band resistance.
Need to be objective: the Super Trend currently indicates an upward move, RSI is 56.4 (neutral to slightly bullish), and MACD shows bullish momentum. These three technical indicators themselves conflict with a bearish call.
From derivatives data: 24-hour trading value is $5.52 million. Open interest is $1.41 million and increased by 5.5% over the past 24 hours, implying this up-move came with clear new contract positions.
Funding rate is +0.0050%, which is roughly neutral to slightly bullish. Long-side accounts account for 61%, indicating sentiment is optimistic.
However, the active buy/sell ratio is 0.76, implying that active sell orders dominate on the order book, which is contrary to the optimistic long-vs-short ratio. This is the main derivatives-based evidence for the bearish bias in this post.
Reference levels: For the shorts, first look at the watch zone 0.1183-0.1217. It is better to wait to observe after a pullback into that range, rather than judge direction directly at the current price.
If the rebound into the watch zone shows stalled progress or signs of pullback, the bearish structure can be considered confirmed. If price rises back above 0.1248, it means the current pullback structure has been broken—then the bearish idea is invalid and it is not advisable to keep holding the thesis.
The downside extension to watch is 0.1125. If it breaks down with volume expansion, then assess whether support near 0.1124 can provide effective follow-through. The two observation levels act as two validation points for the lower structure.
Need to disclose the risk in the opposite direction honestly: besides the three technical indicators already mentioned—Super Trend, RSI, and MACD—which are currently all slightly bullish, there are no other clearly bearish signals in the current data. However, contract leverage itself is a risk source that cannot be ignored.
The reference risk-reward ratio is 0.9, meaning the payoff structure is not favorable.
With contract leverage, position discipline is more important than directional judgment.
Live account disclosure: This account currently holds $FOGO long positions. Structurally, I continue to look for upside; my view is consistent with my positioning.
For reference only and does not constitute investment advice. Contracts involve leverage; investing involves risk.
This article was generated with assistance from an OpenAI large model.
$ARK
#Contract Analysis