👂 This is one of the biggest mistakes beginners make in trading.
They open a 15M or 1H chart, see a coin pumping 50 to 100%, and immediately think: “It’s pumped too much, it’s time to short.”
But when you zoom out to a 1D, 3D, or weekly chart, you realize the coin is still sitting almost at the bottom.
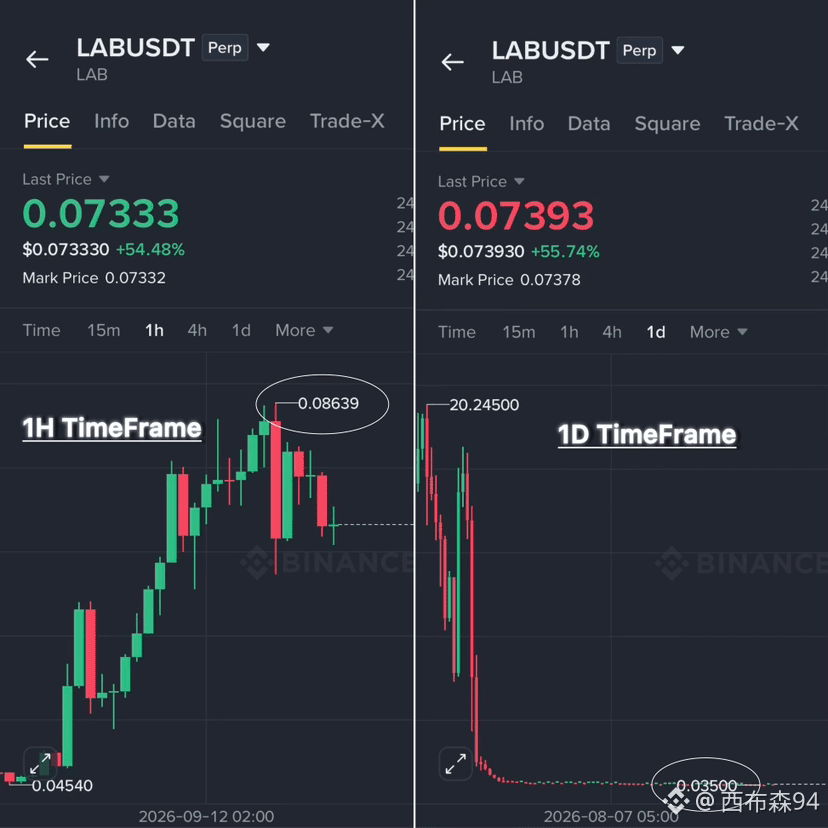
Look at $LAB here. On a 1H chart, it looks like a massive pump from $0.045 to $0.086, but on a 1D timeframe, you’ll see it had dumped from $20 before.
If a coin dumps from $10 to $1, then pumps from $1 to $2, that 100% pump doesn’t automatically mean the price is too high and that it’s ready to dump again.
That’s why scalping isn’t as easy as people think. I always use higher timeframes to understand the main direction first, then lower timeframes to find a good entry.
Click here to trade 👇🏼
$LAB
They open a 15M or 1H chart, see a coin pumping 50 to 100%, and immediately think: “It’s pumped too much, it’s time to short.”
But when you zoom out to a 1D, 3D, or weekly chart, you realize the coin is still sitting almost at the bottom.
Look at $LAB here. On a 1H chart, it looks like a massive pump from $0.045 to $0.086, but on a 1D timeframe, you’ll see it had dumped from $20 before.
If a coin dumps from $10 to $1, then pumps from $1 to $2, that 100% pump doesn’t automatically mean the price is too high and that it’s ready to dump again.
That’s why scalping isn’t as easy as people think. I always use higher timeframes to understand the main direction first, then lower timeframes to find a good entry.
Click here to trade 👇🏼
$LAB