A true hunter never cheers in a crater. $LAB — is this rebound an opportunity or a meat grinder?
Market news: Recently, LAB saw a surge in attention, which also coincided with a surge in trading volume and a drop. In the past 24 hours, its ranking jumped from 7th to 5th, yet the price has still fallen cumulatively by 1.6% to $0.0721. This “volume-price divergence” is a dramatic signal of disagreement among market participants.
Technical analysis: On the 1-hour chart, 0.0718 is short-term resistance formed by the rebound after a sharp earlier drop. The price has been consolidating around 0.0700, suggesting that selling pressure has eased, but buyers are not particularly active. The KDJ J value has fallen to 12.32, placing it in the oversold zone—short-term correction/repair is needed. However, MACD remains negative, and the overall structure is still weak.
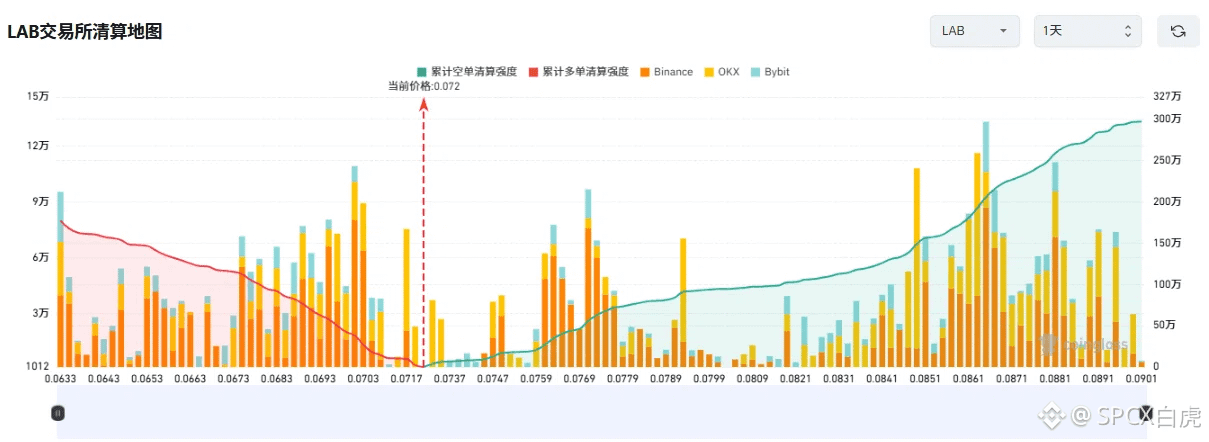
Order flow: On the 1D timeframe, net outflows exceed 17 million, but on the 4H/8H timeframes it has turned into net inflows, suggesting that some funds are attempting to bottom-fish in the short term. The liquidation map shows that around 0.072, the liquidation strength between longs and shorts is relatively balanced, with no clear directional guidance.
Trading strategy: 0.0718 is the dividing line. If it breaks out and holds above it, you may cautiously try a long position,
As for this LAB setup, at its core it’s a chain reaction triggered by a liquidity crisis: first, a golden pit is smashed out by leveraged liquidations; then, after shorts cover, it pulls out a massive bullish candle.
Want to know the exact entry level, where the safest stop-loss should be set, and how to avoid real-time information gaps? Click in and join the chatroom White Tiger below 👇.
#英伟达洽谈至多100亿美元投资Anthropic #以太坊时隔七个月重返2600美元
Market news: Recently, LAB saw a surge in attention, which also coincided with a surge in trading volume and a drop. In the past 24 hours, its ranking jumped from 7th to 5th, yet the price has still fallen cumulatively by 1.6% to $0.0721. This “volume-price divergence” is a dramatic signal of disagreement among market participants.
Technical analysis: On the 1-hour chart, 0.0718 is short-term resistance formed by the rebound after a sharp earlier drop. The price has been consolidating around 0.0700, suggesting that selling pressure has eased, but buyers are not particularly active. The KDJ J value has fallen to 12.32, placing it in the oversold zone—short-term correction/repair is needed. However, MACD remains negative, and the overall structure is still weak.
Order flow: On the 1D timeframe, net outflows exceed 17 million, but on the 4H/8H timeframes it has turned into net inflows, suggesting that some funds are attempting to bottom-fish in the short term. The liquidation map shows that around 0.072, the liquidation strength between longs and shorts is relatively balanced, with no clear directional guidance.
Trading strategy: 0.0718 is the dividing line. If it breaks out and holds above it, you may cautiously try a long position,
As for this LAB setup, at its core it’s a chain reaction triggered by a liquidity crisis: first, a golden pit is smashed out by leveraged liquidations; then, after shorts cover, it pulls out a massive bullish candle.
Want to know the exact entry level, where the safest stop-loss should be set, and how to avoid real-time information gaps? Click in and join the chatroom White Tiger below 👇.
#英伟达洽谈至多100亿美元投资Anthropic #以太坊时隔七个月重返2600美元