
Right now, everyone is talking about inflation, a possible rate hike, oil, the war, and the CLARITY law.
But it’s not the news itself that matters, but how the market reacts to it. It’s the price that shows how all this noise is truly being assessed by market participants.
And now the overall picture is becoming increasingly clear.
As I told you, one of the main confirmations is the ETH/BTC chart. Its structure practically repeats the 2019–2020 period and has long indicated that the strength we’re seeing in $ETH today will, sooner or later, reveal itself.
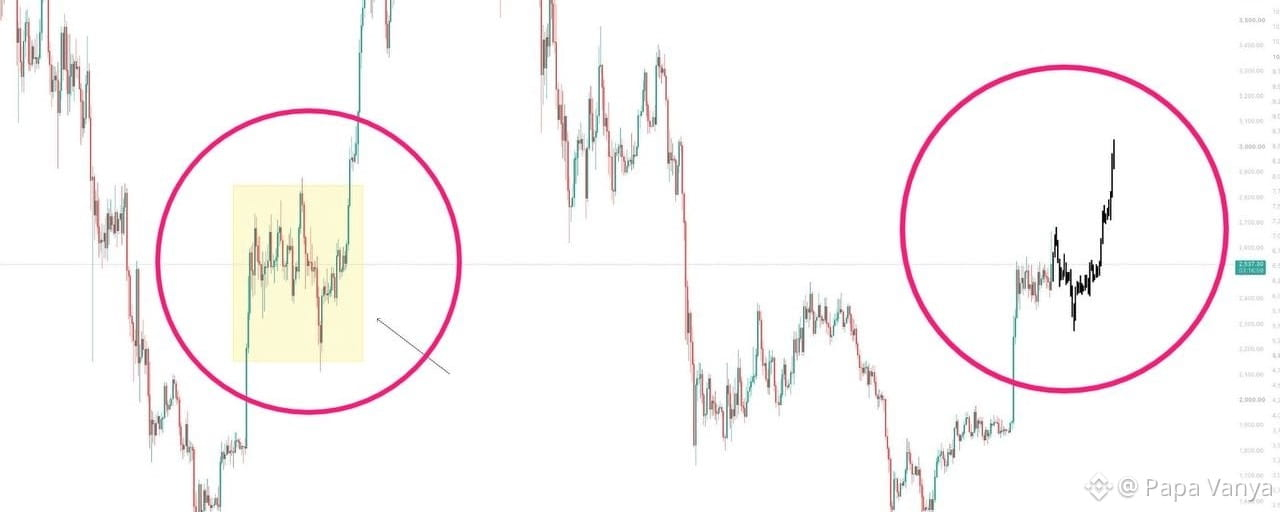
Therefore, I expect consolidation, sharp pullbacks, and attempts to shake out those who can’t handle the volatility—roughly as shown in the chart.
I overlaid on the current chart the structure that formed in 2025 before the assault on nearly $5,000. Look closely at the highlighted sections—the similarity is really hard not to notice.
⛔But most importantly, something has already changed: the market has switched back to a bullish mode, and the priority is now directed upward.
If the analogy keeps playing out, $ETH returning to historical highs could happen within the next 4–5 months.
Don’t let local fluctuations knock you out of the bigger picture. This move is only just starting to become obvious.

Article
Good morning, friends ☕️
🚀 THE MOST INTERESTING PART FOR $ETH IS STARTING