
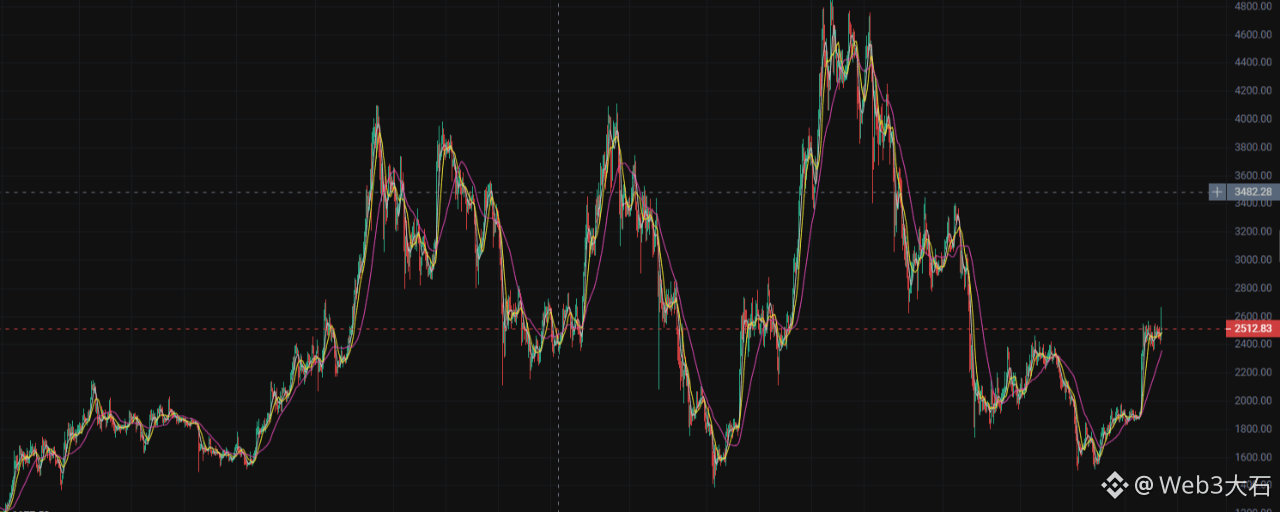

On September 12, $ETH at the current price 2510.55. Judging by the overall recent trend, ETH has gone through a round of sharp rebound; the price once surged toward the 2560 area, but resistance above gradually became evident. ETH has now returned to around the 2500 level, and bulls and bears are engaged in intense fighting at this key zone.
From the recent market technical structure, after ETH’s rebound earlier, it entered a high-range consolidation phase. The 2500–2560 zone remains an important short-term resistance area, while around 2410 is the more critical support area for now.
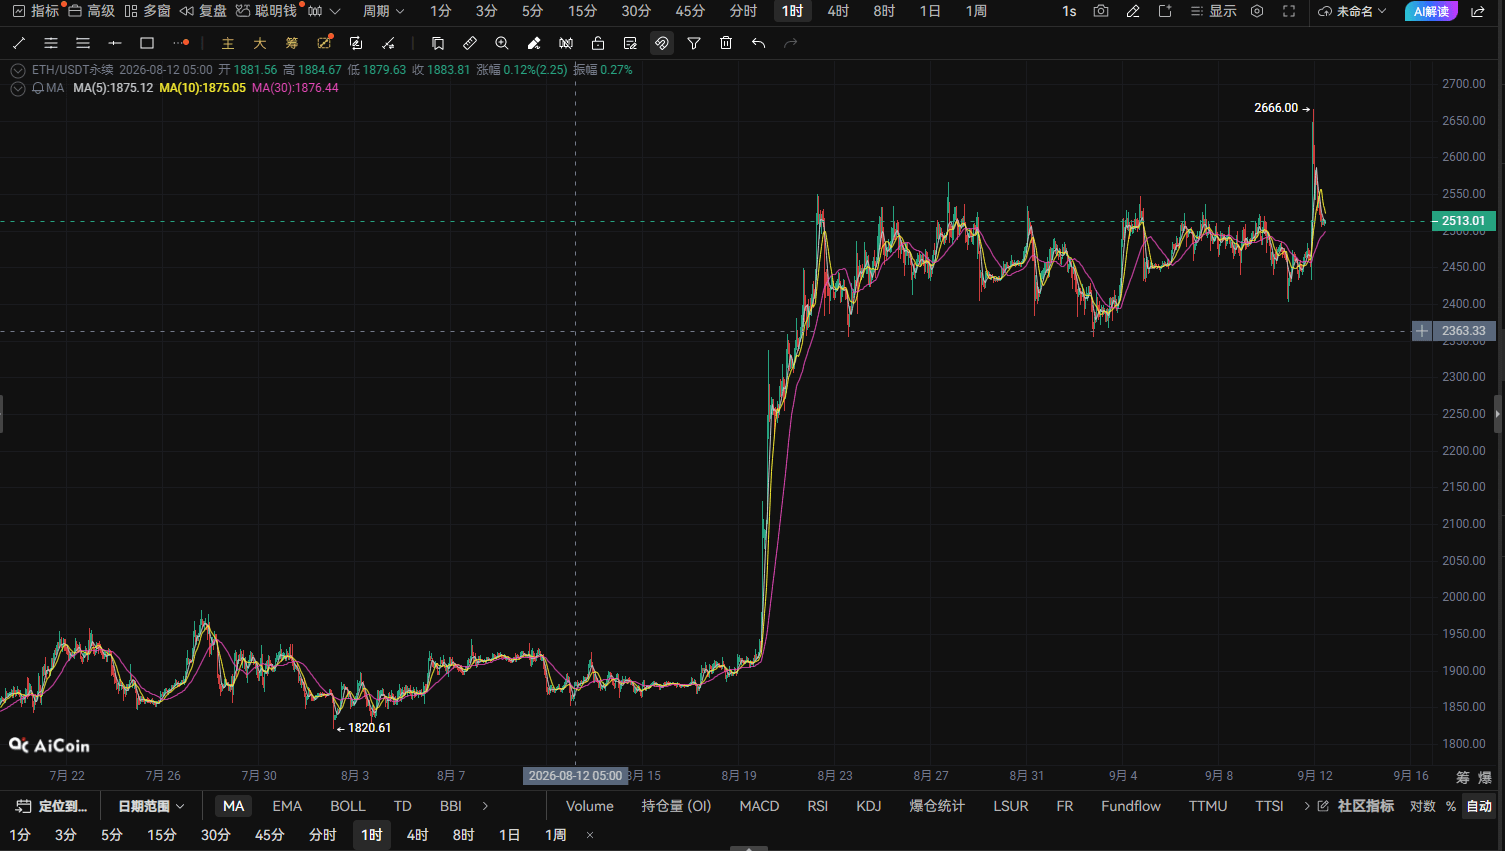
Hourly chart: repeatedly met with resistance above 2500, and short-term bullish momentum is starting to weaken
Based on the K-line, ETH’s 1-hour timeframe saw a rapid surge earlier, but once the price moved above 2500, it began to slow down noticeably. Recently, the K-line has been repeatedly consolidating at high levels; during attempts to push higher, it has met continuous resistance. This indicates that there is strong short-term sell pressure at this level.
From the short-cycle structure, the moving averages have started to gradually converge. Although the price has not yet shown a clear breakdown, the upward momentum and pace are no longer as smooth as earlier. Especially around 2500, repeated tug-of-war suggests that for the bulls to continue breaking higher, they need stronger volume support.
If the short-term price cannot effectively hold above the 2520—2550 zone, then the profit-taking accumulated during the earlier rally may start to be released. The price may need to move downward to find support.
1-hour timeframe viewpoint: upward momentum at high levels is weakening; resistance above 2500 is obvious. The short term needs to be cautious about a rally turning into a pullback.
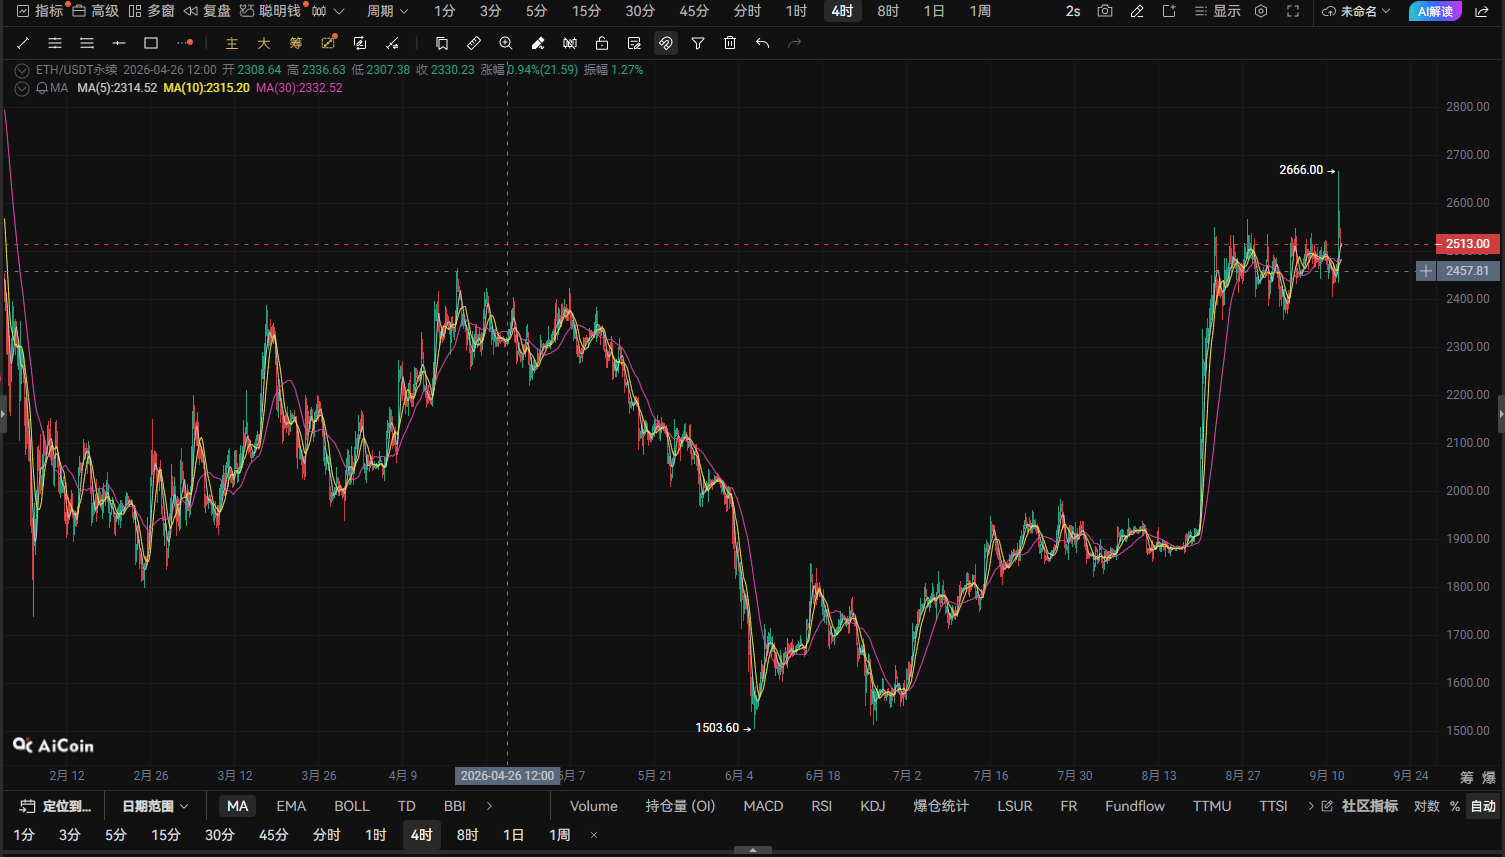
4-hour chart: The uptrend is not broken, but the risk of high-level consolidation and correction is increasing
Based on the K-line on the 4-hour timeframe, ETH’s previous upward trend still exists, but it has now entered a more clearly defined high-range consolidation phase.
It is worth noting that ETH has tested the resistance area upward multiple times recently, but the follow-through after each breakout has been limited. This suggests that while there are still long capital participants in the market, the sell pressure above cannot be ignored either.
From a technical structure perspective, the 2500—2560 zone has become the current important resistance area. If the 4-hour timeframe cannot break through this level with increased volume, then the price is likely to continue ranging, and may even see a more noticeable technical pullback. Recent analysis also shows that on the 4-hour timeframe, ETH has short-term structural divergence, and some technical models indicate a risk of a pullback from the high that should be closely watched.
Pay close attention below at around 2480 and 2460. Once short-term support loosens, the bears may further expand their advantage.
4-hour timeframe viewpoint: the trend is still in a repair structure, but high-level pressure keeps accumulating, and short-term pullback risk is increasing.
Daily chart: the large trend is biased bullish, but the 2500 level determines the direction in the short term
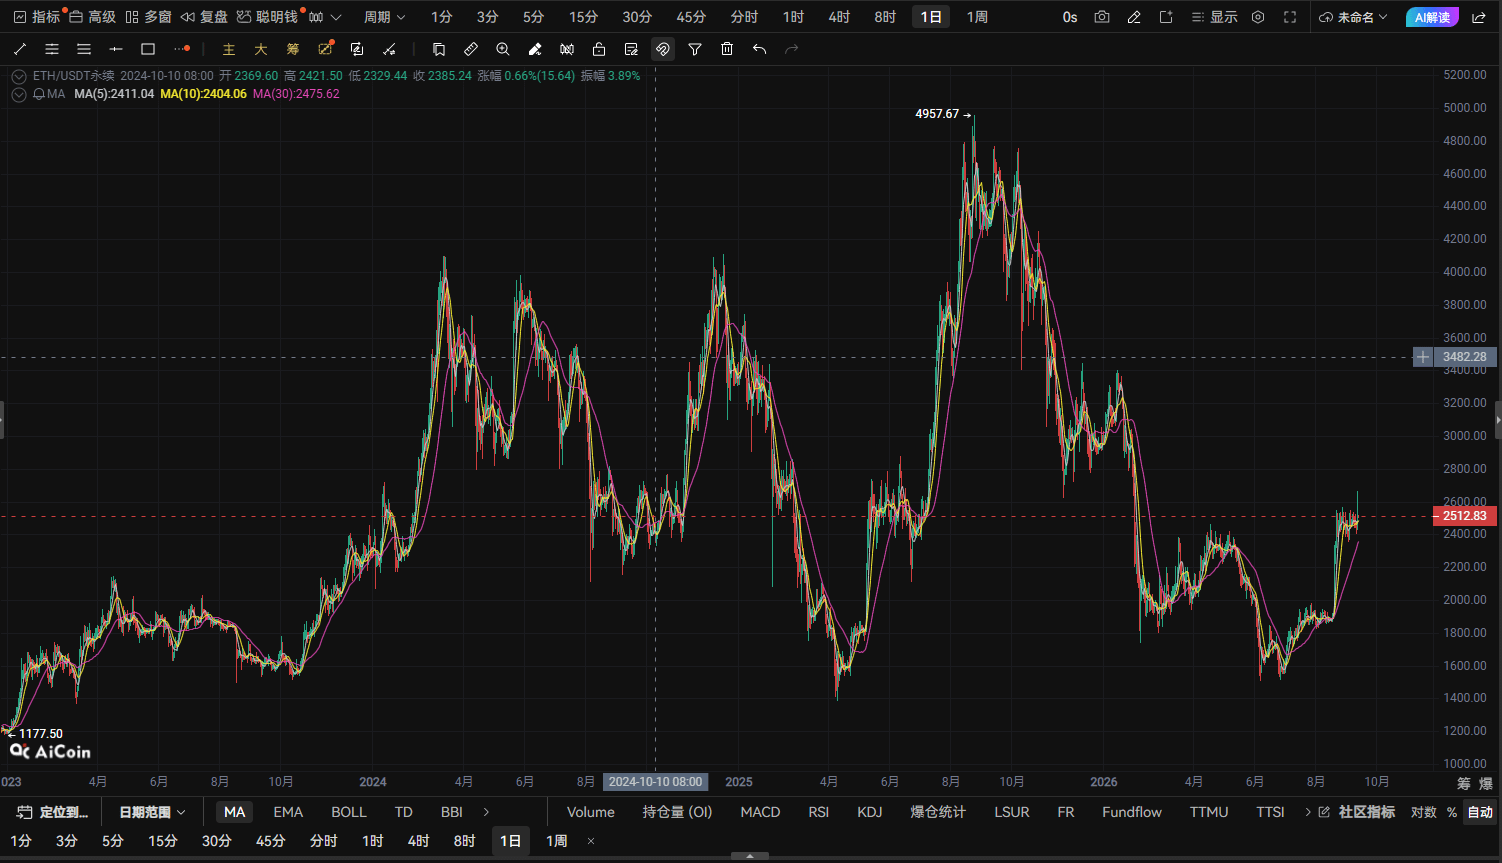
On the daily chart, ETH’s overall structure has improved significantly compared to earlier. The prior rally pushed the price back above multiple medium-term moving averages, indicating that the bulls’ large-cycle trend has not been completely damaged.
But it’s important to note that even if the trend is biased bullish, it doesn’t mean the price will keep rising.
After ETH’s previous rapid rally, the market needs to digest profit-taking through consolidation or a pullback. The 2500—2560 zone has already become an important resistance area on the daily timeframe. If the price cannot effectively break through consistently, then a short-term correction is more in line with technical patterns.
Recent market analysis also indicates that around 2500—2560 there is important resistance above ETH, while around 2410 is a key support level that determines whether the current trend can remain stable.
Therefore, the core logic of the daily chart is currently:
The larger trend has not completely turned bad, but the short-term price has already reached the resistance area. The risk of continuing to chase longs is rising.
For short-term trading, rather than blindly chasing longs at resistance levels, it’s better to watch for pullback opportunities after price is rejected on a push higher.
Daily chart viewpoint: the medium-term structure still has support, but the short term is in a resistance area, with a need for a technical pullback.
ETH market summary for today
Based on the 1-hour chart, 4-hour chart, and daily chart, ETH currently shows a fairly clear structure of **“strong on the large cycle, under pressure on the short cycle.”**
The 1-hour chart shows that upward momentum is starting to weaken. The 4-hour chart has entered high-level consolidation. Although the daily chart still maintains a recovery trend, the 2500—2560 zone has always been the key resistance area that the market must break through.
Therefore, today’s trading approach is more biased toward shorting on the short term.
My view is: ETH’s current price is already near a key resistance area. If it cannot continue breaking out on short-term with increased volume, then the probability of a rally turning into a pullback is likely to increase gradually. In terms of execution, focus on the potential pullback room after resistance at the highs, but risk must be strictly controlled.
Trading is not about chasing longs just because prices are rising, nor about chasing shorts just because prices are falling. The real opportunities often appear when market sentiment is most uncertain and the price is closest to a key level.
Those who look at the trend decide the direction; those who look at levels control the risk. What truly widens the gap is execution.
ETH real-time trading advice
Direction: short
Entry price: 2510.55
Stop-loss price: 2548.21
First take-profit: 2485.44
Second take-profit: 2460.34