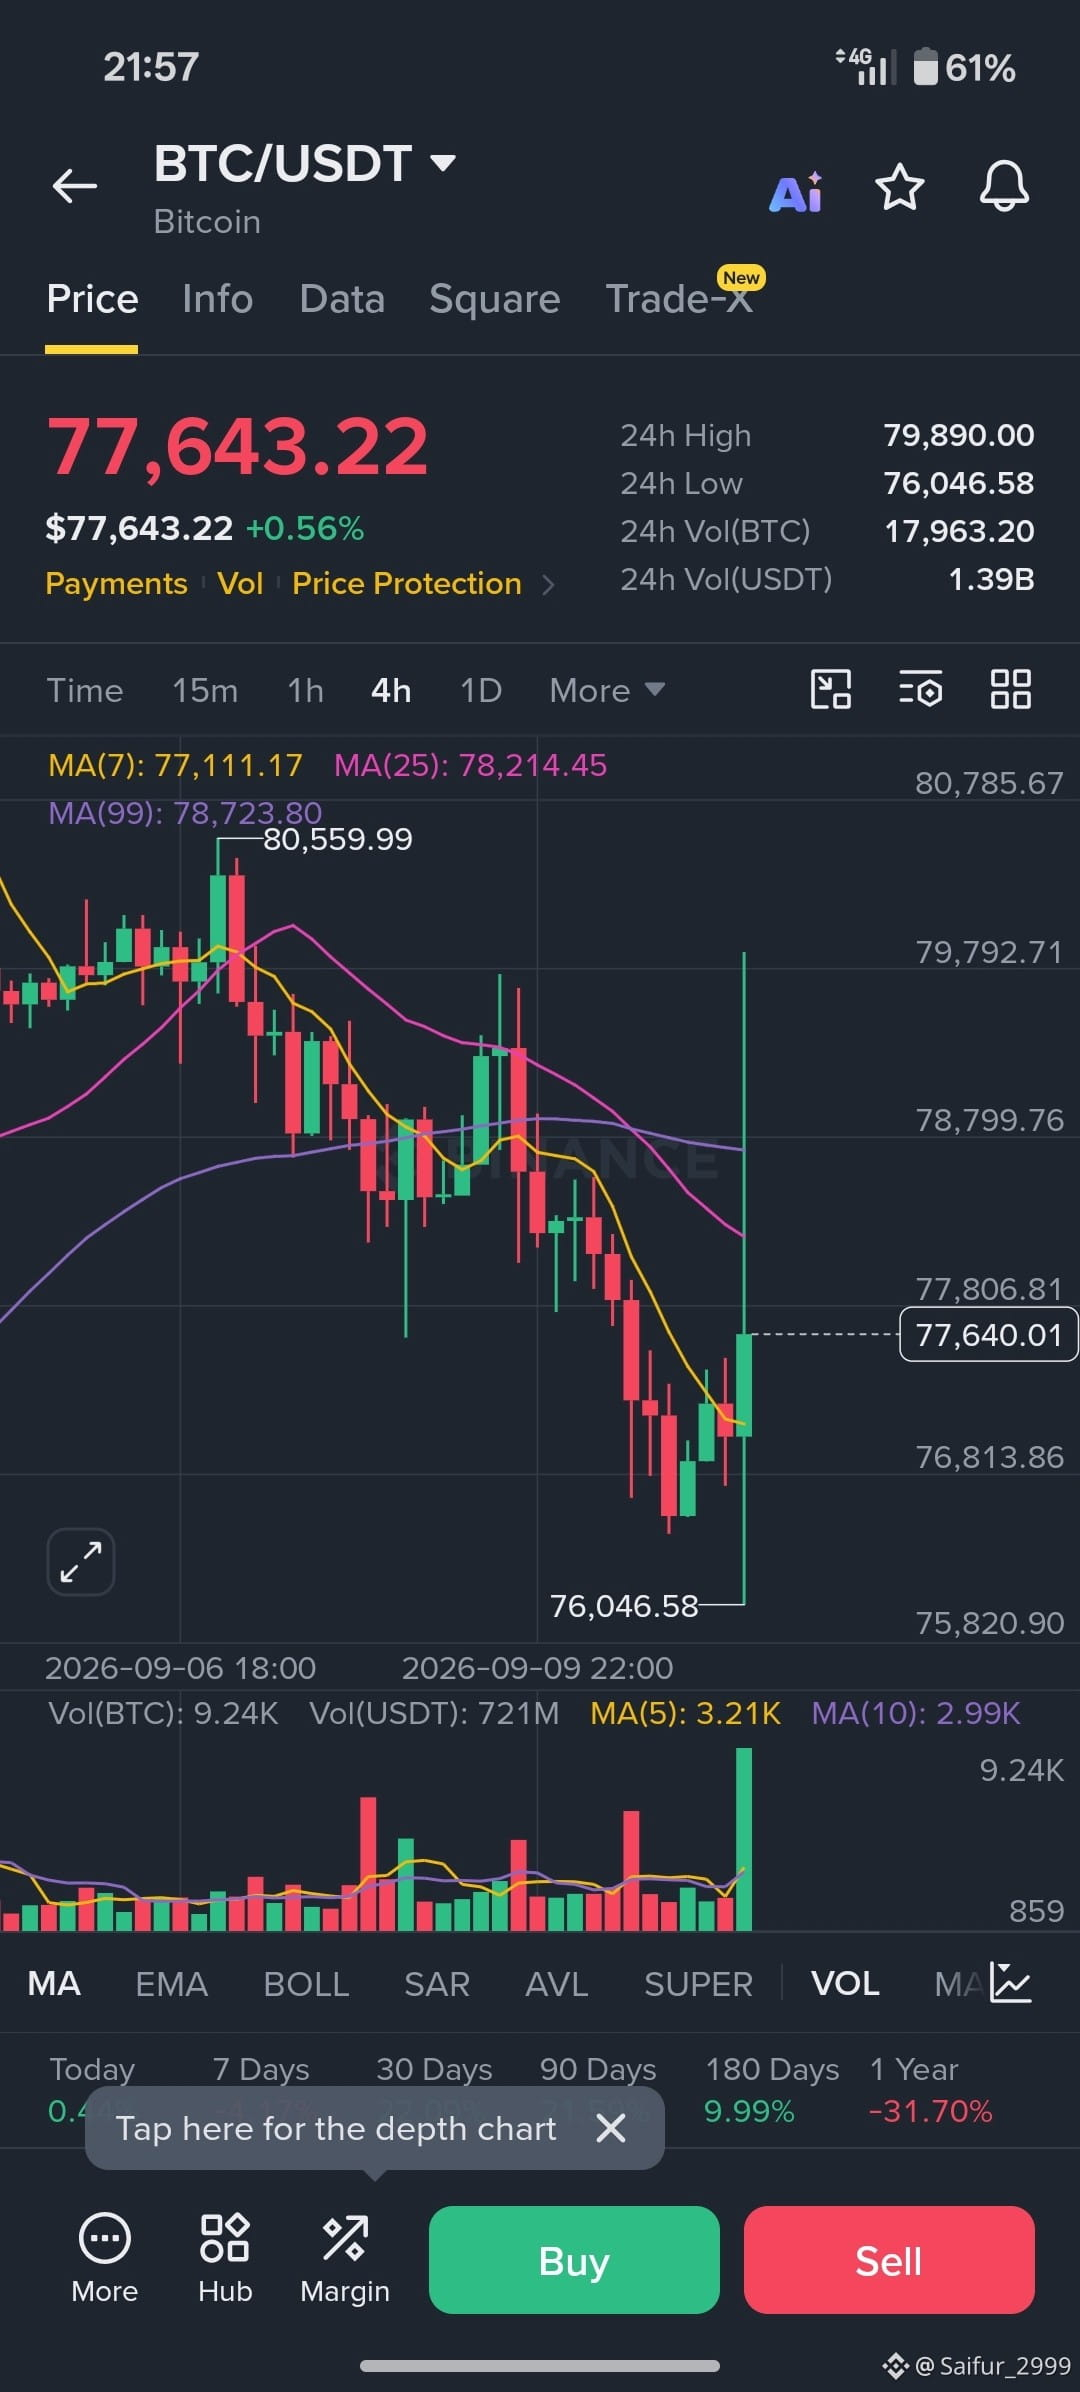
📊 #BTC / USDT (4-Hour Chart Analysis)
📈 Market Overview:
Bitcoin ($BTC) recently hit a local low near $76,046 and is currently experiencing a strong bullish bounce, trading around $77,640.
🔹 Key Support Zone: $76,000 – $76,500
🔹 Immediate Resistance: $78,200 – $78,700 (MA 25 & MA 99 levels)
🔹 Major Resistance: $80,550
💡 Analysis:
Price has shown a sharp green recovery candle off the bottom support. If BTC holds above the $77,000 zone, we could see a push towards testing the key resistance near $78,200 to $78,700. However, failure to maintain momentum might lead to a retest of the $76,000 support level.
🚨 Risk Note: Always practice strict risk management and use proper stop-loss levels.
$BTC #CryptoAnalysis #Trading #BinanceSquare #BTCUSDT
(Disclaimer: This post is for educational purposes only and not financial advice.)
📈 Market Overview:
Bitcoin ($BTC) recently hit a local low near $76,046 and is currently experiencing a strong bullish bounce, trading around $77,640.
🔹 Key Support Zone: $76,000 – $76,500
🔹 Immediate Resistance: $78,200 – $78,700 (MA 25 & MA 99 levels)
🔹 Major Resistance: $80,550
💡 Analysis:
Price has shown a sharp green recovery candle off the bottom support. If BTC holds above the $77,000 zone, we could see a push towards testing the key resistance near $78,200 to $78,700. However, failure to maintain momentum might lead to a retest of the $76,000 support level.
🚨 Risk Note: Always practice strict risk management and use proper stop-loss levels.
$BTC #CryptoAnalysis #Trading #BinanceSquare #BTCUSDT
(Disclaimer: This post is for educational purposes only and not financial advice.)