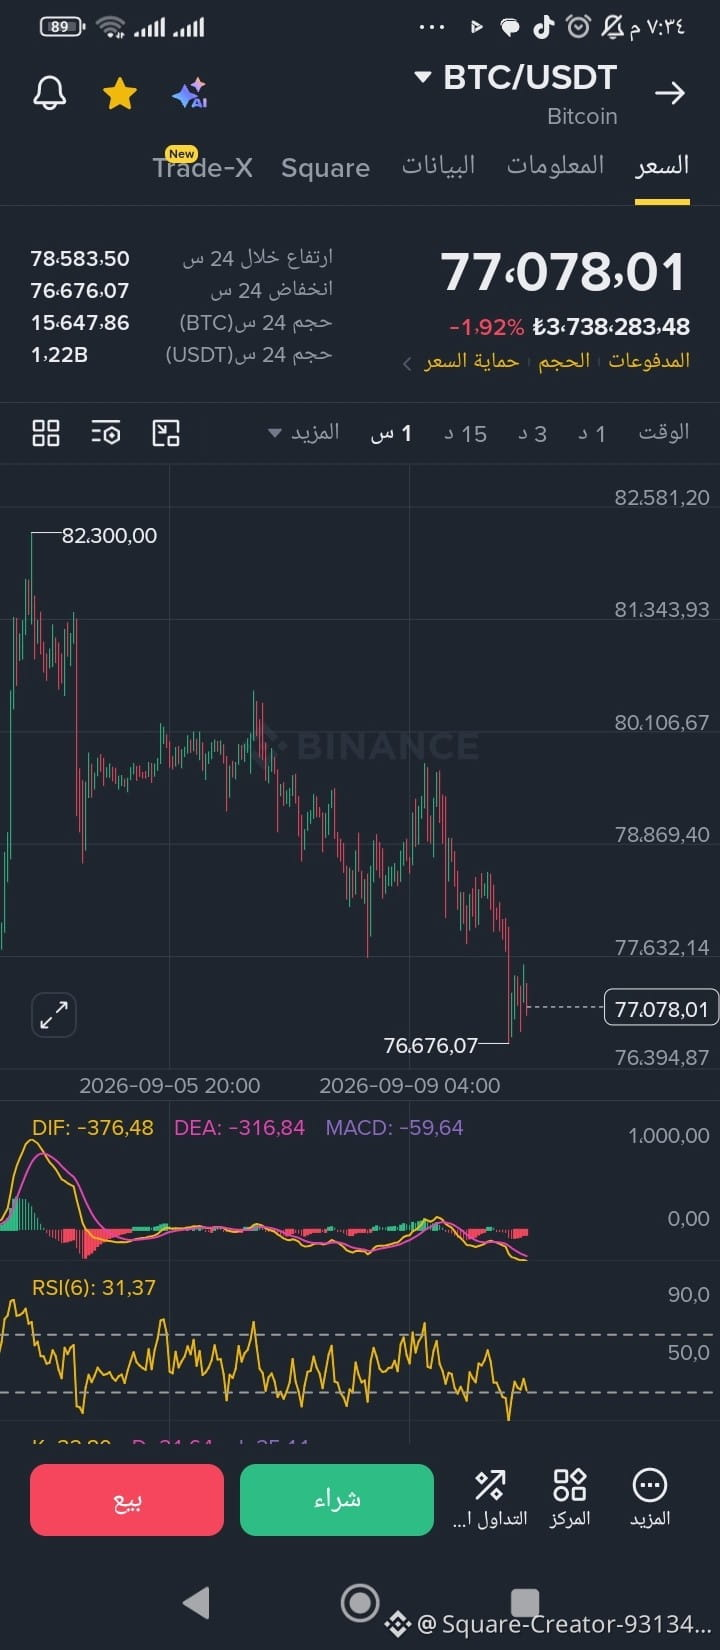
BTC/USDT pair chart analysis based on different timeframes in the attached images:
Price movement summary:
* Current price: fluctuates around 77,062 - 77,093 USDT.
* Nearby support level: 76,676 - 76,804 USDT (the lowest level recorded recently).
* Nearby resistance levels:
* 77,544 USDT (15-minute timeframe immediate resistance).
* 79,760 USDT (hourly timeframe resistance).
* 82,300 USDT (daily timeframe resistance).
Technical analysis by timeframes:
* Monthly timeframe (1M):
* The overall long-term trend is still bullish after reaching a historical peak near 126,199 USDT.
* The current movement represents a downward correction from the top peak, as the price tested major support areas around 76,000 - 77,000 USDT.
* Daily (1D) and 1H timeframes:
* Trend: bearish in the short and medium term.
* RSI (6) indicator: stands at low levels (around 31.37 on the daily chart), suggesting the price is approaching oversold regions, which may trigger a temporary speculative rebound.
* MACD indicator: a negative crossover and the indicator lines are below the zero line, indicating that selling pressure is still ongoing so far.
* Intraday timeframe (15 minutes):
* Shows a modest attempt to bounce from the intraday low at 76,804 USDT toward 77,544 USDT, with the MACD indicator returning to give a slight positive crossover (MACD: 7.04).
Upcoming movement scenarios:
* The bullish scenario ).$BTC #SECApprovesNasdaqTexasCommodityTrustRule
Price movement summary:
* Current price: fluctuates around 77,062 - 77,093 USDT.
* Nearby support level: 76,676 - 76,804 USDT (the lowest level recorded recently).
* Nearby resistance levels:
* 77,544 USDT (15-minute timeframe immediate resistance).
* 79,760 USDT (hourly timeframe resistance).
* 82,300 USDT (daily timeframe resistance).
Technical analysis by timeframes:
* Monthly timeframe (1M):
* The overall long-term trend is still bullish after reaching a historical peak near 126,199 USDT.
* The current movement represents a downward correction from the top peak, as the price tested major support areas around 76,000 - 77,000 USDT.
* Daily (1D) and 1H timeframes:
* Trend: bearish in the short and medium term.
* RSI (6) indicator: stands at low levels (around 31.37 on the daily chart), suggesting the price is approaching oversold regions, which may trigger a temporary speculative rebound.
* MACD indicator: a negative crossover and the indicator lines are below the zero line, indicating that selling pressure is still ongoing so far.
* Intraday timeframe (15 minutes):
* Shows a modest attempt to bounce from the intraday low at 76,804 USDT toward 77,544 USDT, with the MACD indicator returning to give a slight positive crossover (MACD: 7.04).
Upcoming movement scenarios:
* The bullish scenario ).$BTC #SECApprovesNasdaqTexasCommodityTrustRule