$NEAR , $WLFI 30 minutes golden cross with increased volume, 4-hour moving averages in a bullish alignment pointing upward🔥
════════════════════
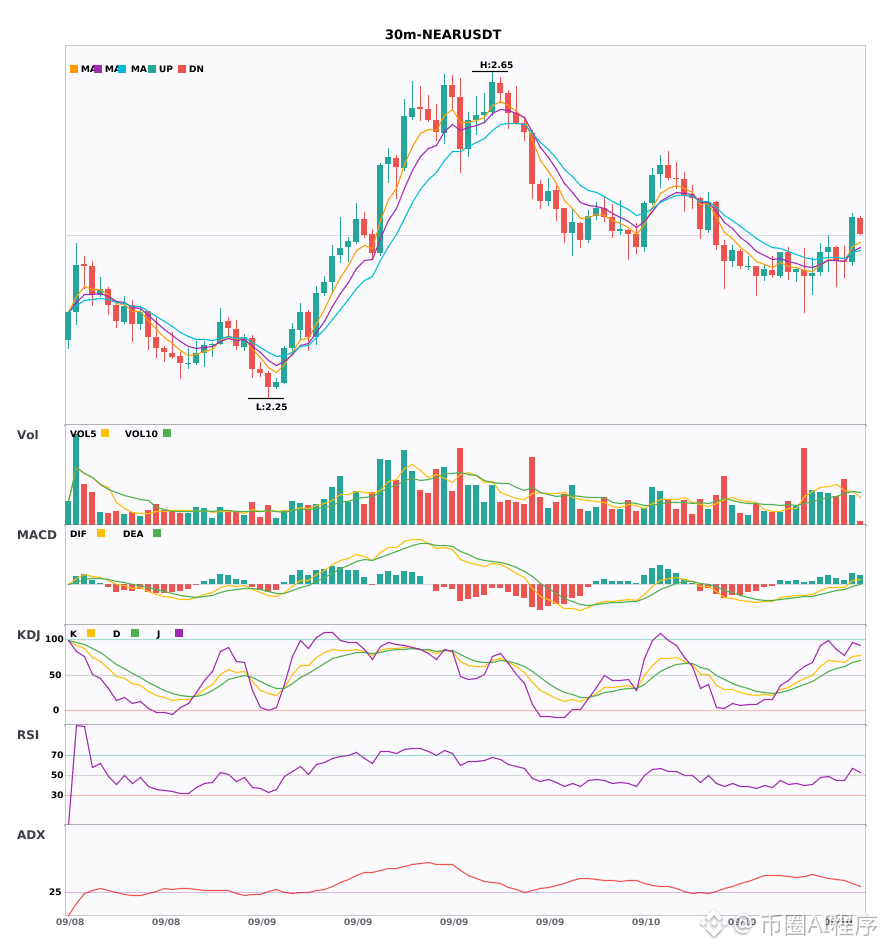
🔴 $NEAR 30 minutes Bullish signal
⚠️ Technicals: The 4-hour chart is also bullish, resonating with the 30-minute timeframe. On the 30-minute chart, the MACD DIF has just crossed above the zero axis, indicating a shift to an uptrend; EMA5, 8, 13 are bullish and spreading upward; KDJ’s K has crossed above D at 76.4, and it hasn’t entered overbought yet; volume has increased by 1.4x.
📢 Market updates: Bitcoin is hovering around $78,000. The market may be facing macro shocks this week that could be underestimated. With fundamentals currently unfavorable, any deviation in CPI data, central bank policy, or oil prices could determine whether Bitcoin can break out from the existing range.
════════════════════
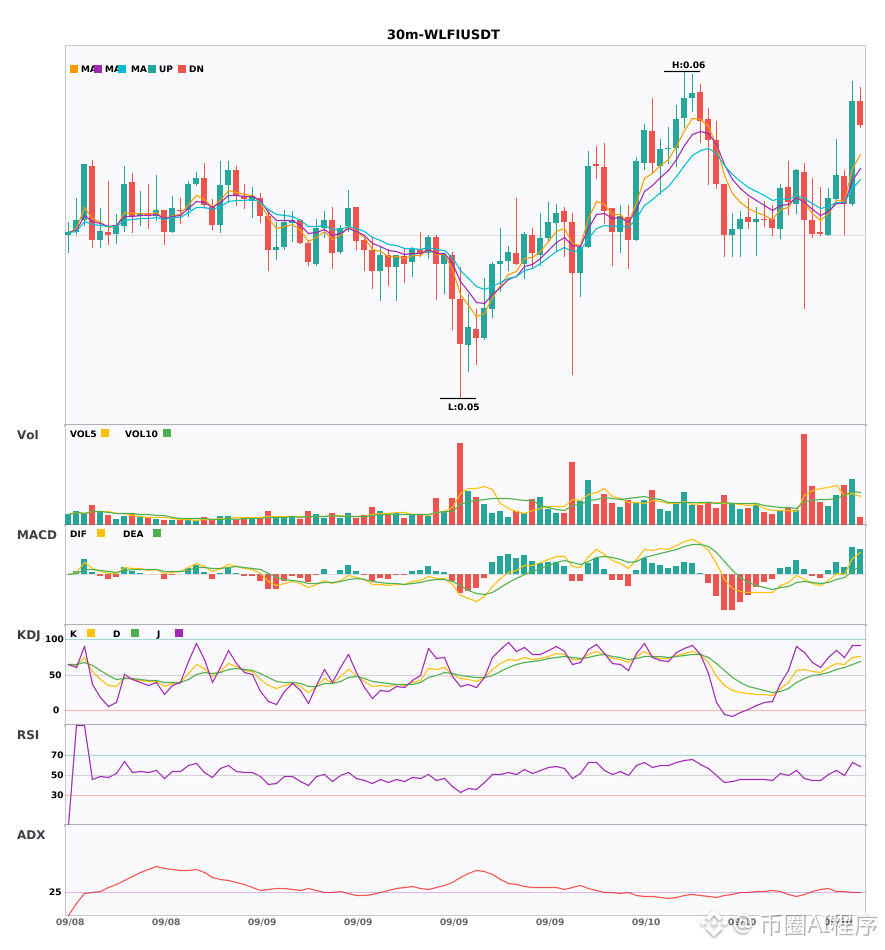
🔴 $WLFI 30 minutes Bullish signal
⚠️ Technicals: Multi-timeframe bullish resonance between the 30-minute and 4-hour charts! On the 30-minute chart, the MACD DIF has just crossed above the zero axis, shifting the trend to bullish; EMA5, 8, 13 are bullish and spreading upward; KDJ’s K value 73.8 is above the D value 64.9, still not overbought; trading volume is up 1.4x, and the volume supports the move well.
════════════════════
🔔 Watch for first-hand alerts of market anomalies 🔔
#多周期共振 #NEAR #WLFI
📌 When trading, pay attention to whether the candlestick patterns match the criteria
════════════════════
🔴 $NEAR 30 minutes Bullish signal
⚠️ Technicals: The 4-hour chart is also bullish, resonating with the 30-minute timeframe. On the 30-minute chart, the MACD DIF has just crossed above the zero axis, indicating a shift to an uptrend; EMA5, 8, 13 are bullish and spreading upward; KDJ’s K has crossed above D at 76.4, and it hasn’t entered overbought yet; volume has increased by 1.4x.
📢 Market updates: Bitcoin is hovering around $78,000. The market may be facing macro shocks this week that could be underestimated. With fundamentals currently unfavorable, any deviation in CPI data, central bank policy, or oil prices could determine whether Bitcoin can break out from the existing range.
════════════════════
🔴 $WLFI 30 minutes Bullish signal
⚠️ Technicals: Multi-timeframe bullish resonance between the 30-minute and 4-hour charts! On the 30-minute chart, the MACD DIF has just crossed above the zero axis, shifting the trend to bullish; EMA5, 8, 13 are bullish and spreading upward; KDJ’s K value 73.8 is above the D value 64.9, still not overbought; trading volume is up 1.4x, and the volume supports the move well.
════════════════════
🔔 Watch for first-hand alerts of market anomalies 🔔
#多周期共振 #NEAR #WLFI
📌 When trading, pay attention to whether the candlestick patterns match the criteria