DAILY SIGNAL — SOL/USDT
Date: 10 Sep 2026 Timeframe: 1m Intraday Bias: Support retest → potential bullish continuation
📊 Market Bias
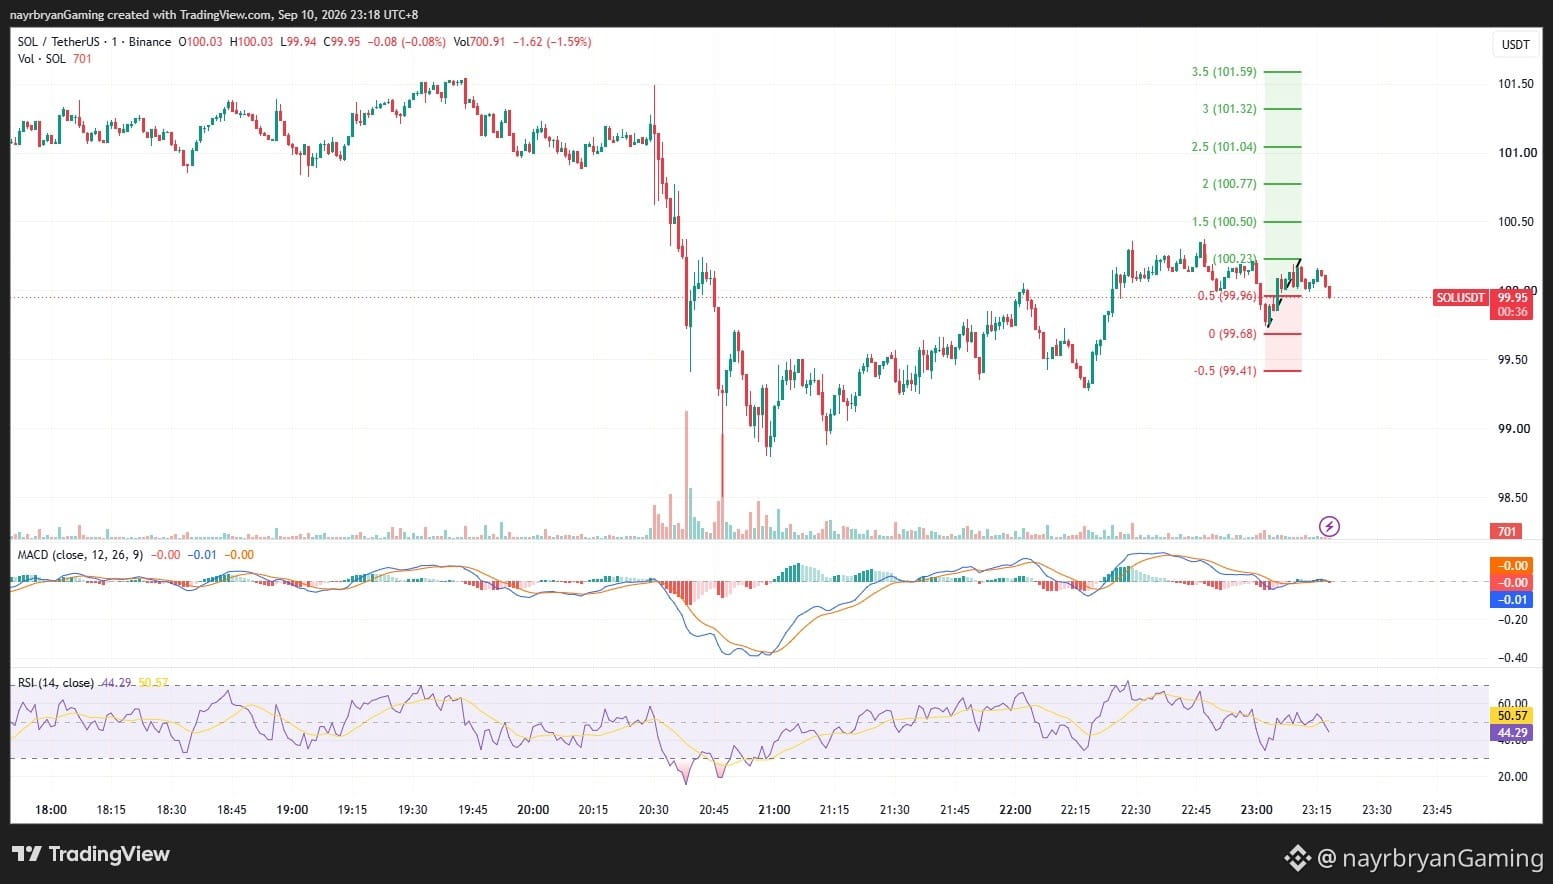
SOL is trading inside a short-term ascending channel after recovering from the sharp sell-off.
Price is currently testing the 99.68–99.90 structure zone, with the current price around 99.90.
The 99.68 level is the marked Fibonacci 0 level, while 99.90 is the 0.5 level.
As long as the ascending structure and 99.68 support hold, the chart remains open for a potential rotation toward higher Fibonacci levels.
🔹 Key Levels From Chart
Key Structure Zone: 99.68 → 99.90
Fibonacci 0: 99.68
Fibonacci 0.5: 99.90
First Major Upside Level: 100.22
🎯 Upside Fibonacci Targets
TP1 → 100.22 (1.0 Fib) TP2 → 100.50 (1.5 Fib) TP3 → 100.77 (2.0 Fib) TP4 → 101.04 (2.5 Fib) TP5 → 101.32 (3.0 Fib) TP6 → 101.59 (3.5 Fib)
🔻 Downside Level
If the structure fails below the marked support:
99.41 (-0.5 Fib)
A sustained break below 99.68 would weaken the current bullish continuation structure.
📈 Technical Breakdown
SOL recovered from the lower part of the ascending channel and moved back toward the 100.22 area.
After reaching the upper portion of the recent structure, price pulled back and is now testing the 99.68–99.90 zone.
MACD is close to the zero line, showing that momentum is currently relatively balanced.
RSI is around 42, indicating short-term weakness without being deeply oversold.
The key reaction area remains 99.68–99.90.
A successful support reaction could allow price to rotate toward:
100.22 → 100.50 → 100.77 → 101.04
🧠 Quick Insight
“Good structure gives traders a level to respect, not a reason to chase.”
⚠️ Disclaimer
This is personal market analysis, not financial advice. This chart framework is for educational purposes only.
Always DYOR / DYODD, manage risk properly, and avoid emotional trading.
— @nayrbryanGaming #SOL #SOLUSDT #Crypto #Trading #TechnicalAnalysis #PriceAction #Fibonacci #Binance #DYOR #NFA #NoFOMO
Date: 10 Sep 2026 Timeframe: 1m Intraday Bias: Support retest → potential bullish continuation
📊 Market Bias
SOL is trading inside a short-term ascending channel after recovering from the sharp sell-off.
Price is currently testing the 99.68–99.90 structure zone, with the current price around 99.90.
The 99.68 level is the marked Fibonacci 0 level, while 99.90 is the 0.5 level.
As long as the ascending structure and 99.68 support hold, the chart remains open for a potential rotation toward higher Fibonacci levels.
🔹 Key Levels From Chart
Key Structure Zone: 99.68 → 99.90
Fibonacci 0: 99.68
Fibonacci 0.5: 99.90
First Major Upside Level: 100.22
🎯 Upside Fibonacci Targets
TP1 → 100.22 (1.0 Fib) TP2 → 100.50 (1.5 Fib) TP3 → 100.77 (2.0 Fib) TP4 → 101.04 (2.5 Fib) TP5 → 101.32 (3.0 Fib) TP6 → 101.59 (3.5 Fib)
🔻 Downside Level
If the structure fails below the marked support:
99.41 (-0.5 Fib)
A sustained break below 99.68 would weaken the current bullish continuation structure.
📈 Technical Breakdown
SOL recovered from the lower part of the ascending channel and moved back toward the 100.22 area.
After reaching the upper portion of the recent structure, price pulled back and is now testing the 99.68–99.90 zone.
MACD is close to the zero line, showing that momentum is currently relatively balanced.
RSI is around 42, indicating short-term weakness without being deeply oversold.
The key reaction area remains 99.68–99.90.
A successful support reaction could allow price to rotate toward:
100.22 → 100.50 → 100.77 → 101.04
🧠 Quick Insight
“Good structure gives traders a level to respect, not a reason to chase.”
⚠️ Disclaimer
This is personal market analysis, not financial advice. This chart framework is for educational purposes only.
Always DYOR / DYODD, manage risk properly, and avoid emotional trading.
— @nayrbryanGaming #SOL #SOLUSDT #Crypto #Trading #TechnicalAnalysis #PriceAction #Fibonacci #Binance #DYOR #NFA #NoFOMO