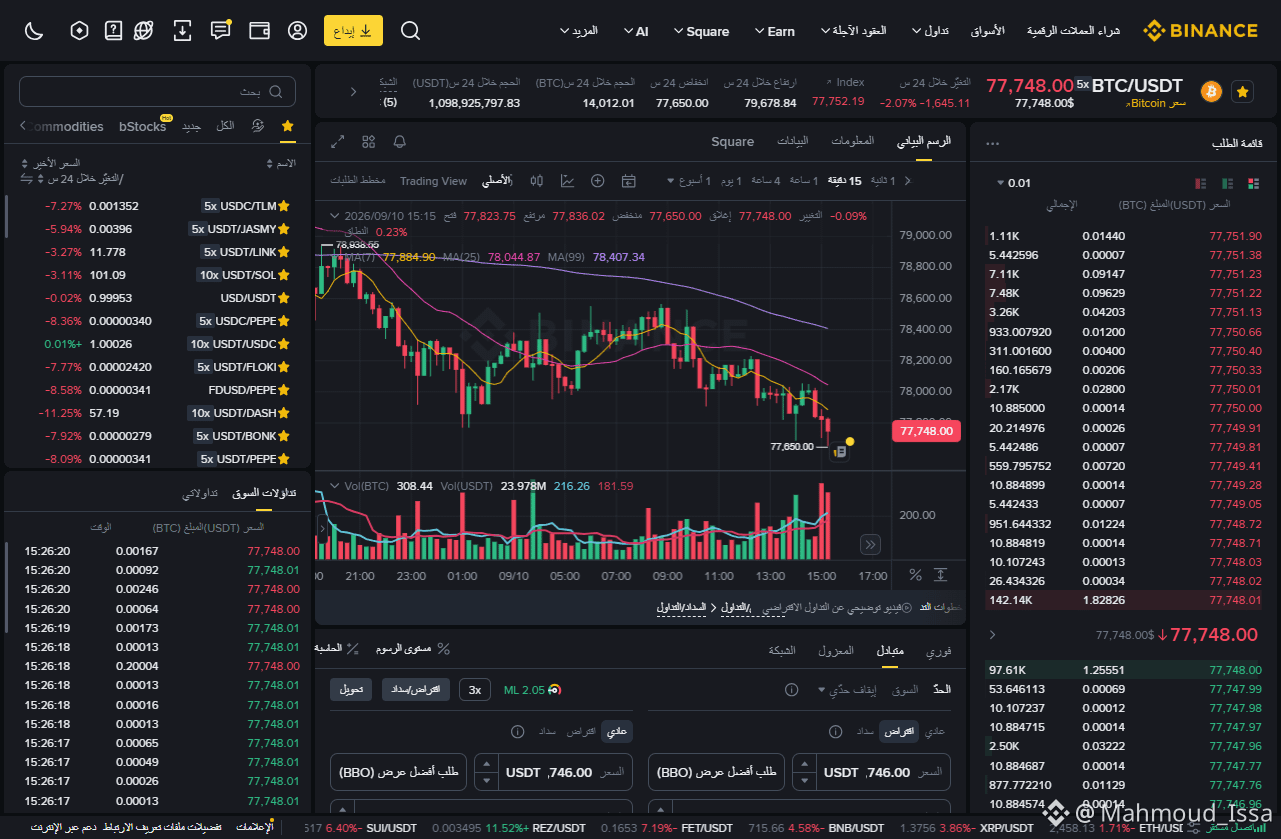
The volume indicator shown below has demonstrated moderate and high sales flows during the recent red candles, reflecting a downward momentum that supports the current movement. 💡 Expected scenarios: Negative scenario (continuation of the downward move): If selling pressure persists and the price cannot recover below $78,000, it may test the next support levels around $77,650 (the lowest point recorded on the current chart). Positive scenario (bounce): To confirm a bounce and start a new upward wave toward $79,000, the price needs to break through the moving averages and stabilize above $78,200.$
$b$$
$b$$