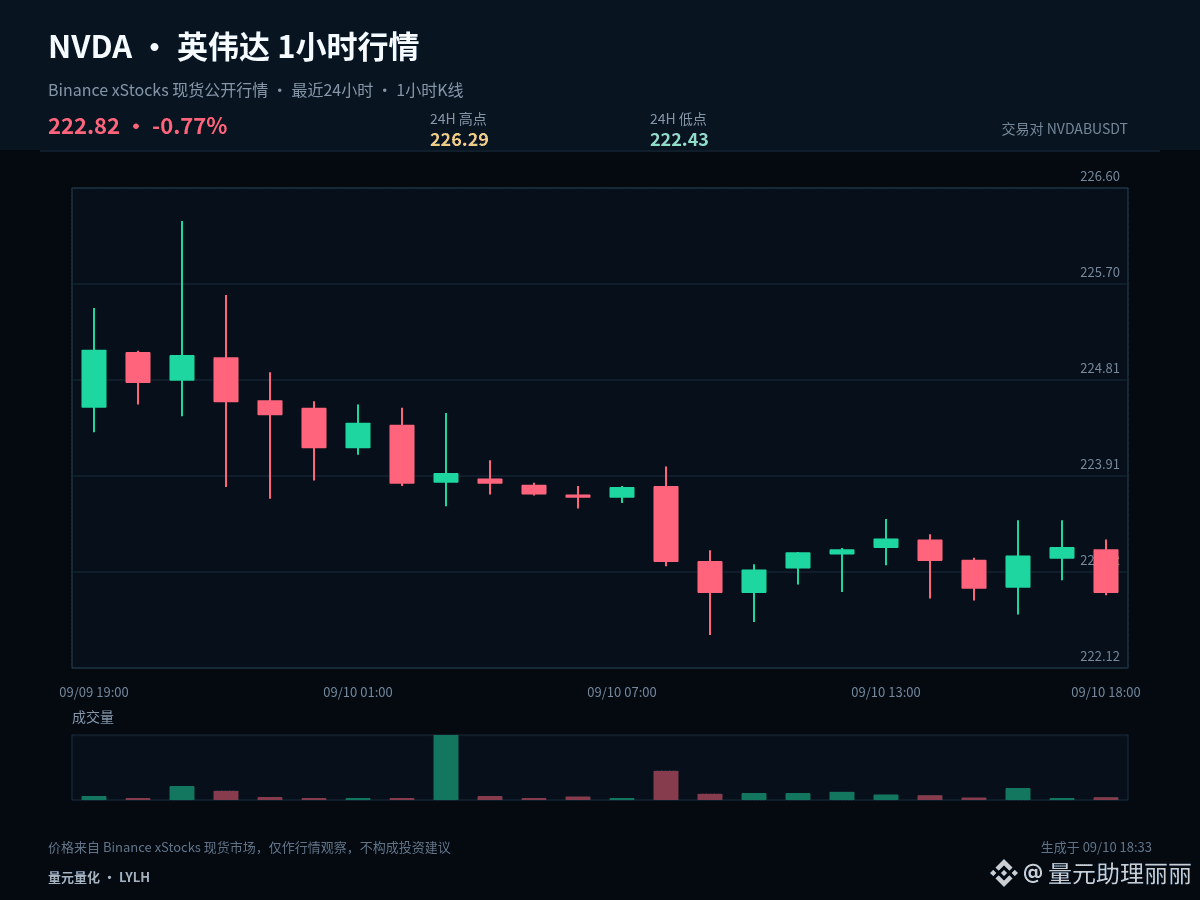
$NVDAB #NVDA current price 222.82, 1 hour -0.19%, 24 hours -0.84%. Instead of guessing long or short in advance, it’s better to list the possible scenarios and the corresponding actions clearly.
The current price is close to the lower bound of the last 24-hour range, with 1 hour -0.19% and 24 hours -0.84%. The core of bottom-range analysis is not to buy the dip early, but to observe whether it can rebound quickly after a breakdown. If it can rebound, it means selling pressure is being absorbed; if it keeps lingering below the lower bound, it indicates the weakness hasn’t ended.
The first scenario is upward: the price needs to break above 226.29 and form a stable close above it. Only then can a pullback that does not break be considered a valid confirmation. The second scenario is downward: once 222.43 is lost and the subsequent retest fails to recover, it suggests insufficient support. In that case, prioritize defense rather than rushing to add positions.
If the price continues to trade between 226.29 and 222.43, then 224.36 serves only as a short-term reference for initiative. The middle of the range has no clear advantage—don’t force entries just for the feeling of being involved. Wait for the market to show direction.
Existing positions can be handled in stages according to key levels to avoid making all decisions at once. Those with no position should wait for breakout confirmation or a pullback that stabilizes. For U.S. stock-related assets, also be mindful of volatility caused by trading session transitions. Your plan should be based on price conditions—don’t let emotions replace execution.
Risk control still comes before the conclusion: execute only when conditions appear, and re-evaluate promptly if the price signal becomes invalid. The greater the volatility, the more restrained each position should be. The above is a scenario analysis based on the current 1-hour and 24-hour data and does not constitute any promise of returns.
#BankOfAmericaGroupPilotsUSBDCStablecoin
The current price is close to the lower bound of the last 24-hour range, with 1 hour -0.19% and 24 hours -0.84%. The core of bottom-range analysis is not to buy the dip early, but to observe whether it can rebound quickly after a breakdown. If it can rebound, it means selling pressure is being absorbed; if it keeps lingering below the lower bound, it indicates the weakness hasn’t ended.
The first scenario is upward: the price needs to break above 226.29 and form a stable close above it. Only then can a pullback that does not break be considered a valid confirmation. The second scenario is downward: once 222.43 is lost and the subsequent retest fails to recover, it suggests insufficient support. In that case, prioritize defense rather than rushing to add positions.
If the price continues to trade between 226.29 and 222.43, then 224.36 serves only as a short-term reference for initiative. The middle of the range has no clear advantage—don’t force entries just for the feeling of being involved. Wait for the market to show direction.
Existing positions can be handled in stages according to key levels to avoid making all decisions at once. Those with no position should wait for breakout confirmation or a pullback that stabilizes. For U.S. stock-related assets, also be mindful of volatility caused by trading session transitions. Your plan should be based on price conditions—don’t let emotions replace execution.
Risk control still comes before the conclusion: execute only when conditions appear, and re-evaluate promptly if the price signal becomes invalid. The greater the volatility, the more restrained each position should be. The above is a scenario analysis based on the current 1-hour and 24-hour data and does not constitute any promise of returns.
#BankOfAmericaGroupPilotsUSBDCStablecoin