NEAR, this move is a bit interesting.
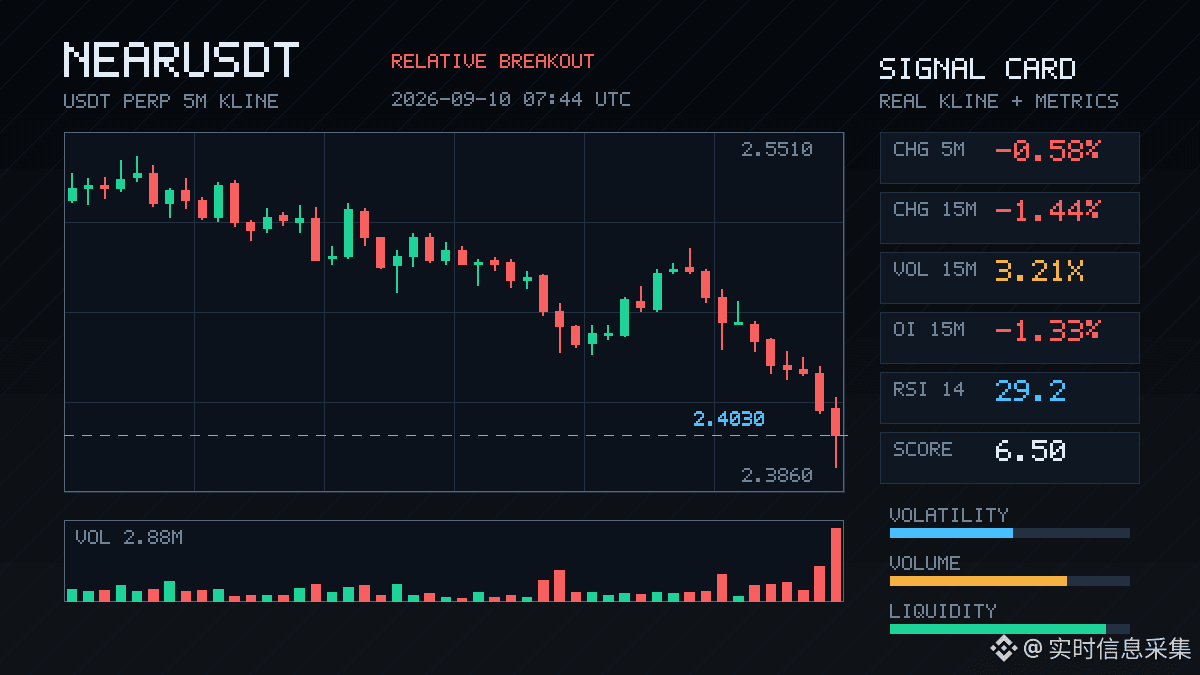
In the 15m timeframe it dropped straight down by 1.44%. Volume expanded to 3.21x, Z-value 2.05, the aggressive trade difference was -27.1%, and the buy/sell ratio was 0.57—selling pressure dominated. And this wasn’t small-scale selling; it was a breakdown with expanding volume. The closing price broke below the lower bound of the recent 20 five-minute K-bar range, and the price-range boundary was driven through directly.
But what really caught my attention was the OI. The 15m contract fell -1.33%, nominal -3.10M; the 1h contract fell -1.59%, nominal -4.85M. Price is down while OI is also down—this is the classic structure of long de-leveraging or stop-loss exits, not a sell-off pushed by new shorts entering. In other words, this liquidation-style drop looks more like longs couldn’t hold up and had to reduce positions.
OI’s abnormal percentile is 98%, the whole-pool abnormal rank is #3, nominal change rank is #2, and it’s been continuing across multiple consecutive cycles—signal density isn’t low. The funding rate is also still in a high percentile recently, which suggests the longs were indeed crowded beforehand; now it’s the process of liquidation and exit.
24h trading value is 494.90M, and depth confirmation is also sufficient. Trading volume is higher than usual, and the aggressive direction is clearly skewed toward the sell side—not just noise.
At near its own historical extreme range, with whole-pool abnormality ranking high. In this kind of spot, I generally wouldn’t rush to catch it. “Multi-kill” moves often don’t come in just one wave—wait for OI to stabilize and for the aggressive trade difference to converge before checking whether there’s a stabilization structure. Chasing shorts here may not be great in terms of risk-reward, especially since OI has already dropped a chunk.
$NEAR
In the 15m timeframe it dropped straight down by 1.44%. Volume expanded to 3.21x, Z-value 2.05, the aggressive trade difference was -27.1%, and the buy/sell ratio was 0.57—selling pressure dominated. And this wasn’t small-scale selling; it was a breakdown with expanding volume. The closing price broke below the lower bound of the recent 20 five-minute K-bar range, and the price-range boundary was driven through directly.
But what really caught my attention was the OI. The 15m contract fell -1.33%, nominal -3.10M; the 1h contract fell -1.59%, nominal -4.85M. Price is down while OI is also down—this is the classic structure of long de-leveraging or stop-loss exits, not a sell-off pushed by new shorts entering. In other words, this liquidation-style drop looks more like longs couldn’t hold up and had to reduce positions.
OI’s abnormal percentile is 98%, the whole-pool abnormal rank is #3, nominal change rank is #2, and it’s been continuing across multiple consecutive cycles—signal density isn’t low. The funding rate is also still in a high percentile recently, which suggests the longs were indeed crowded beforehand; now it’s the process of liquidation and exit.
24h trading value is 494.90M, and depth confirmation is also sufficient. Trading volume is higher than usual, and the aggressive direction is clearly skewed toward the sell side—not just noise.
At near its own historical extreme range, with whole-pool abnormality ranking high. In this kind of spot, I generally wouldn’t rush to catch it. “Multi-kill” moves often don’t come in just one wave—wait for OI to stabilize and for the aggressive trade difference to converge before checking whether there’s a stabilization structure. Chasing shorts here may not be great in terms of risk-reward, especially since OI has already dropped a chunk.
$NEAR