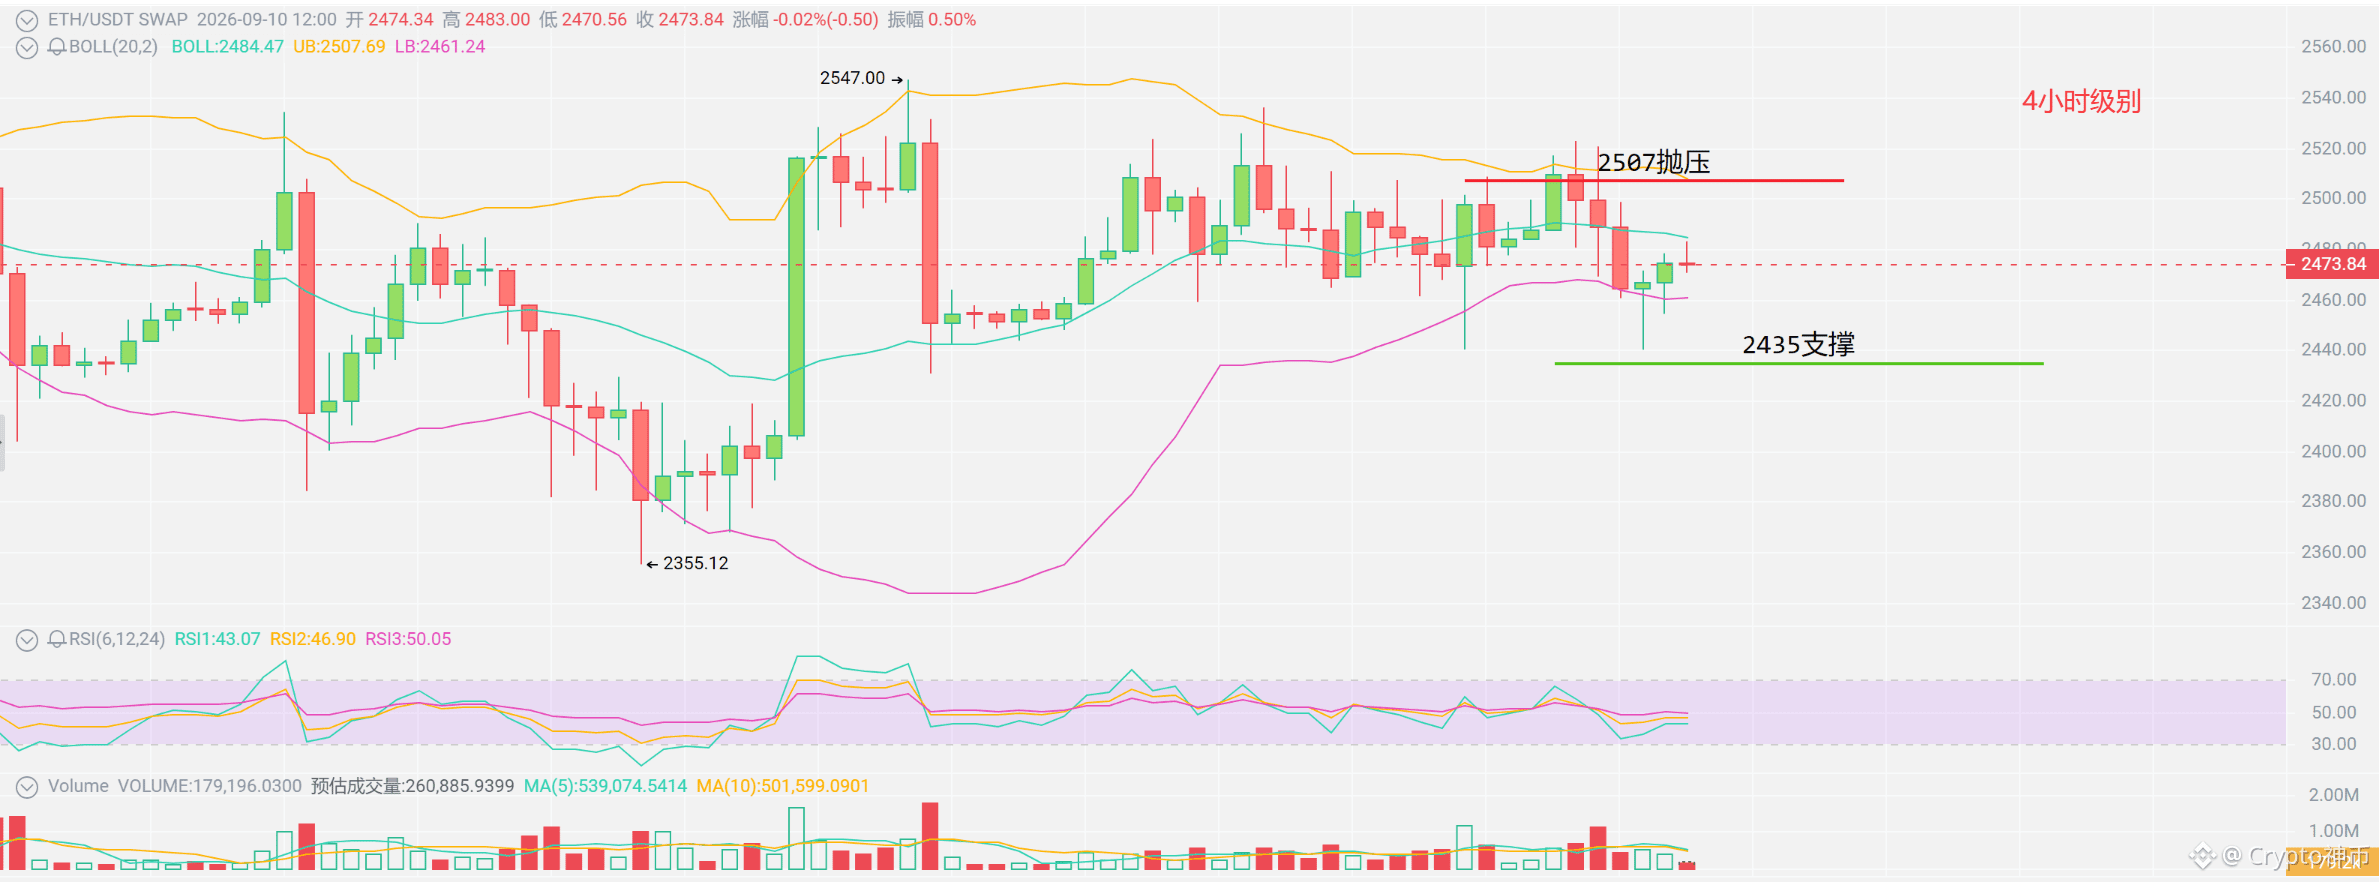
9.10 4-hour chart breakdown of $ETH ! Read the key levels in one article!
Just look at the chart: the Bollinger middle band is 2484.37, the upper band is 2507.78, and the lower band is 2460.97. The Bollinger Bands are clearly contracting—the band width continues to narrow. This is a volatility compression pattern, and a breakout is getting closer.
From the indicators: the current price is trading below the Bollinger middle band. The middle band at 2484 becomes the first short-term resistance. The lower band at 2460 is nearby support. The range is tightly compressed and maintained in a sideways range between 2460 and 2508. The RSI value is in a neutral zone, with a balance between buyers and sellers. In recent sessions, trading volume has been steadily shrinking, and market funds are waiting on the sidelines.
Key resistance is at 2507. Strong support is around 2435. The next plan is to see whether price can hold above the 2484 middle band. Only then will it reopen the upside space to push toward 2507. If it breaks down effectively below 2460 (the lower band), it will trigger a new round of pullback.
Opportunities to enter on breakouts and breakdowns—I'll synchronize in real time in the chat room later.
#美国10年期美债收益率创2023年11月新高
Just look at the chart: the Bollinger middle band is 2484.37, the upper band is 2507.78, and the lower band is 2460.97. The Bollinger Bands are clearly contracting—the band width continues to narrow. This is a volatility compression pattern, and a breakout is getting closer.
From the indicators: the current price is trading below the Bollinger middle band. The middle band at 2484 becomes the first short-term resistance. The lower band at 2460 is nearby support. The range is tightly compressed and maintained in a sideways range between 2460 and 2508. The RSI value is in a neutral zone, with a balance between buyers and sellers. In recent sessions, trading volume has been steadily shrinking, and market funds are waiting on the sidelines.
Key resistance is at 2507. Strong support is around 2435. The next plan is to see whether price can hold above the 2484 middle band. Only then will it reopen the upside space to push toward 2507. If it breaks down effectively below 2460 (the lower band), it will trigger a new round of pullback.
Opportunities to enter on breakouts and breakdowns—I'll synchronize in real time in the chat room later.
#美国10年期美债收益率创2023年11月新高