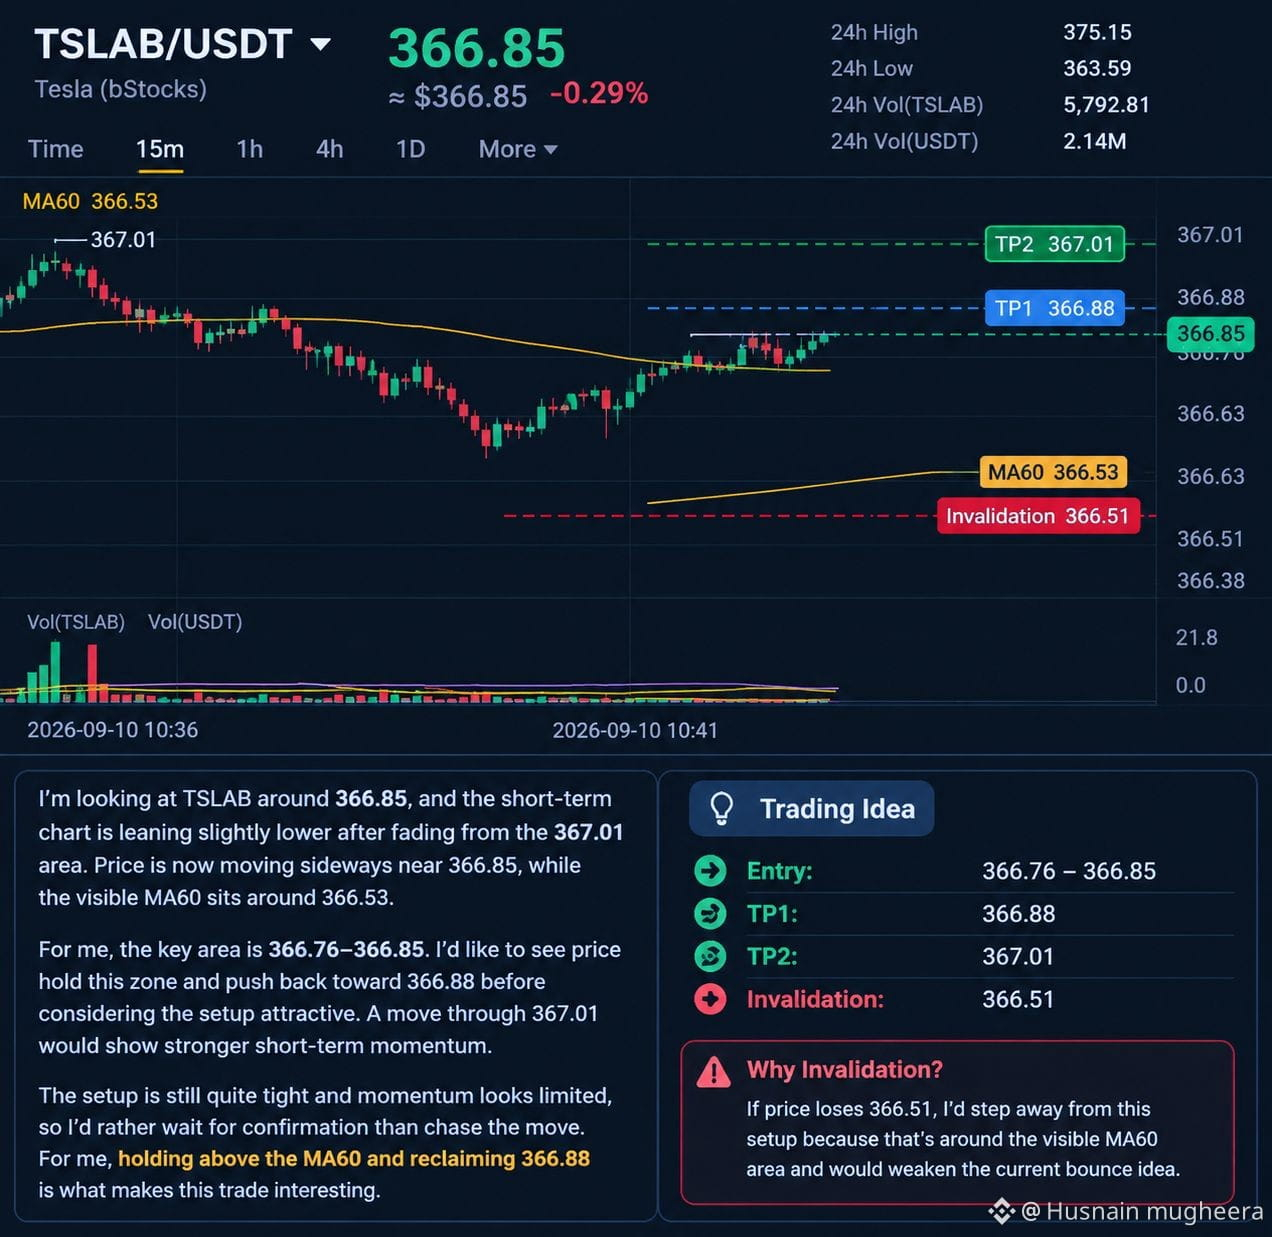
I’m looking at $TSLA / LAB around 366.85, and the short-term chart is leaning slightly lower after fading from the 367.01 area. Price is now moving sideways near 366.85, while the visible MA60 sits around 366.53.
For me, the key area is 366.76–366.85. I’d like to see price hold this zone and push back toward 366.88 before considering the setup attractive. A move through 367.01 would show stronger short-term momentum.
📍 Entry: 366.76–366.85
🎯 TP1: 366.88
🎯 TP2: 367.01
🛑 Invalidation: 366.51
If price loses 366.51, I’d step away from this setup because that’s around the visible MA60 area and would weaken the current bounce idea.
The setup is still quite tight and momentum looks limited, so I’d rather wait for confirmation than chase the move. For me, holding above the MA60 and reclaiming 366.88 is what makes this trade interesting.
For me, the key area is 366.76–366.85. I’d like to see price hold this zone and push back toward 366.88 before considering the setup attractive. A move through 367.01 would show stronger short-term momentum.
📍 Entry: 366.76–366.85
🎯 TP1: 366.88
🎯 TP2: 367.01
🛑 Invalidation: 366.51
If price loses 366.51, I’d step away from this setup because that’s around the visible MA60 area and would weaken the current bounce idea.
The setup is still quite tight and momentum looks limited, so I’d rather wait for confirmation than chase the move. For me, holding above the MA60 and reclaiming 366.88 is what makes this trade interesting.